
Summary
Wildfires are a significant and growing concern in the United States, with an average of 70,025 fires burning approximately 7 million acres annually in the past decade. Climate change and increased development in wildland-urban interface areas have exacerbated the frequency and intensity of wildfires, leading to longer fire seasons and more destructive blazes across the country.
Los Angeles wildfires
The Los Angeles wildfires erupted unusually in January 2025, driven by a perfect storm of extreme weather and environmental conditions. The first blaze ignited on Tuesday morning, January 7th, in the Pacific Palisades area. Fuelled by strong Santa Ana winds with gusts up to 160 km/h (100 mph), the fire rapidly expanded southward. By Wednesday, January 8, multiple fires had developed, including the Palisades Fire, which grew from 300 acres to nearly 3,000 acres in just hours.
The powerful winds, combined with unusually dry vegetation due to a hot summer and dry winter, allowed the fires to spread swiftly from the inland areas towards the coast, threatening communities from Topanga to the Pacific shoreline.
Skytek utilized thermal satellite imagery to track the development of fire clusters as they progressed. Figure 1 illustrates the primary fire clusters wreaking havoc in the Pacific Palisades, Eaton, and Hurst areas, with red patches indicating heat signatures recorded on January 9th, 2025.

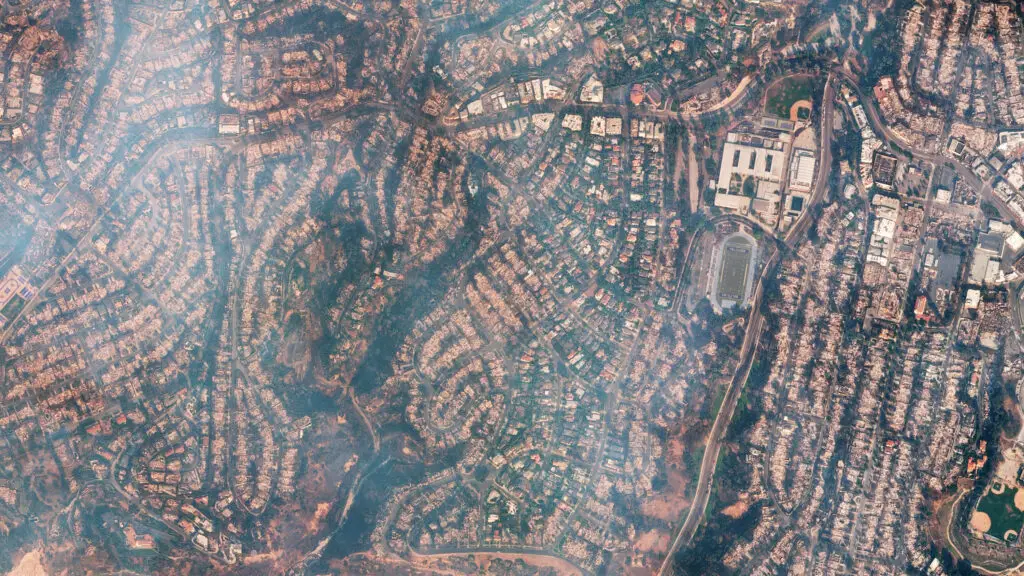
The Los Angeles wildfires rapidly escalated since their erupting in the morning of January 7th, 2025. By January 08th, multiple fires had erupted across the region, including the Palisades Fire, Eaton Fire near Pasadena, Hurst Fire in Sylmar, and Woodley Fire in a natural reserve.
As of January 11th, authorities have issued evacuation orders affecting more than 150,000 residents, the area consumed by blazes went over 47,000 acres, with an estimated of 12,000 buildings destroyed and 57,000 structures still under threat.
In response to the rapidly evolving Los Angeles wildfires, Skytek deployed its cutting-edge technology to provide critical support and analysis. Utilizing high-resolution imagery systems and proprietary machine learning algorithms, Skytek’s team implemented advanced damage detection and mapping capabilities to support tracking of the fire’s progression, precise mapping of affected properties and environmental damage, and rapid quantification of losses.
Skytek depicted in Figure 2 an overview of the Pacific Palisades acquired just before the wildfires, and in Figure 3, the post event imagery of the same area, with a damage layer overlaid after the imagery has been processed and analysed for fire related damage.
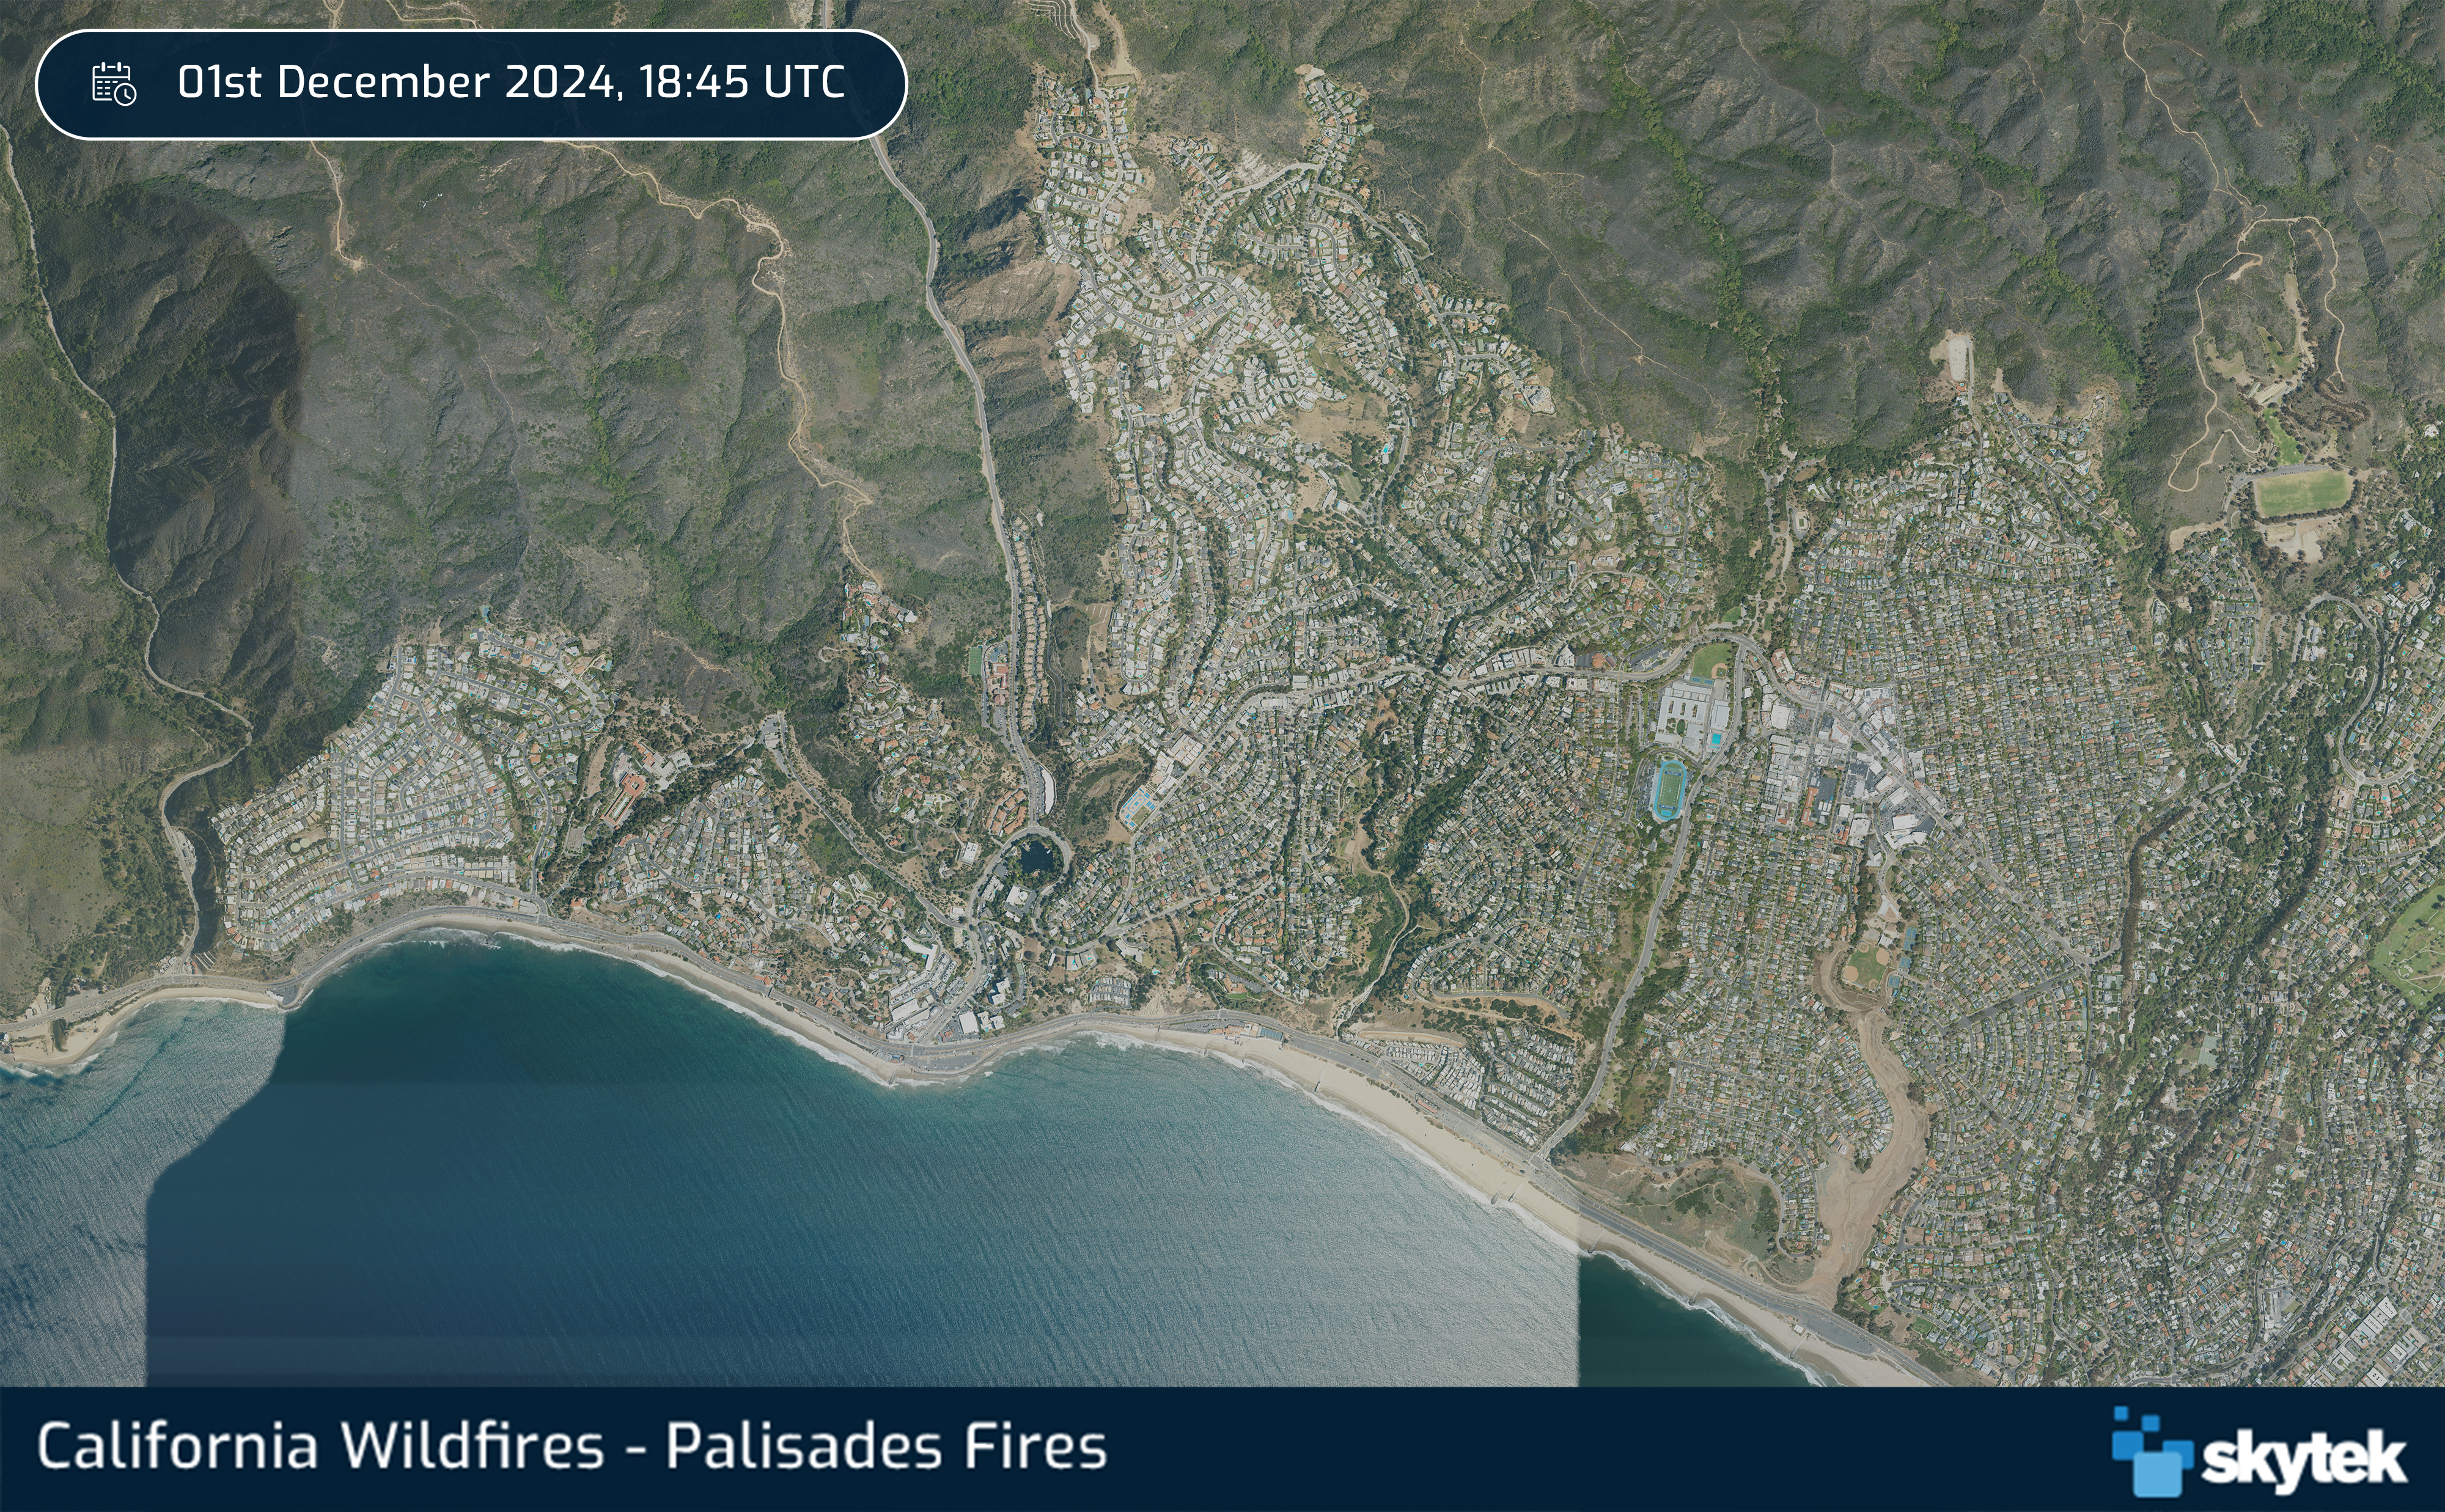
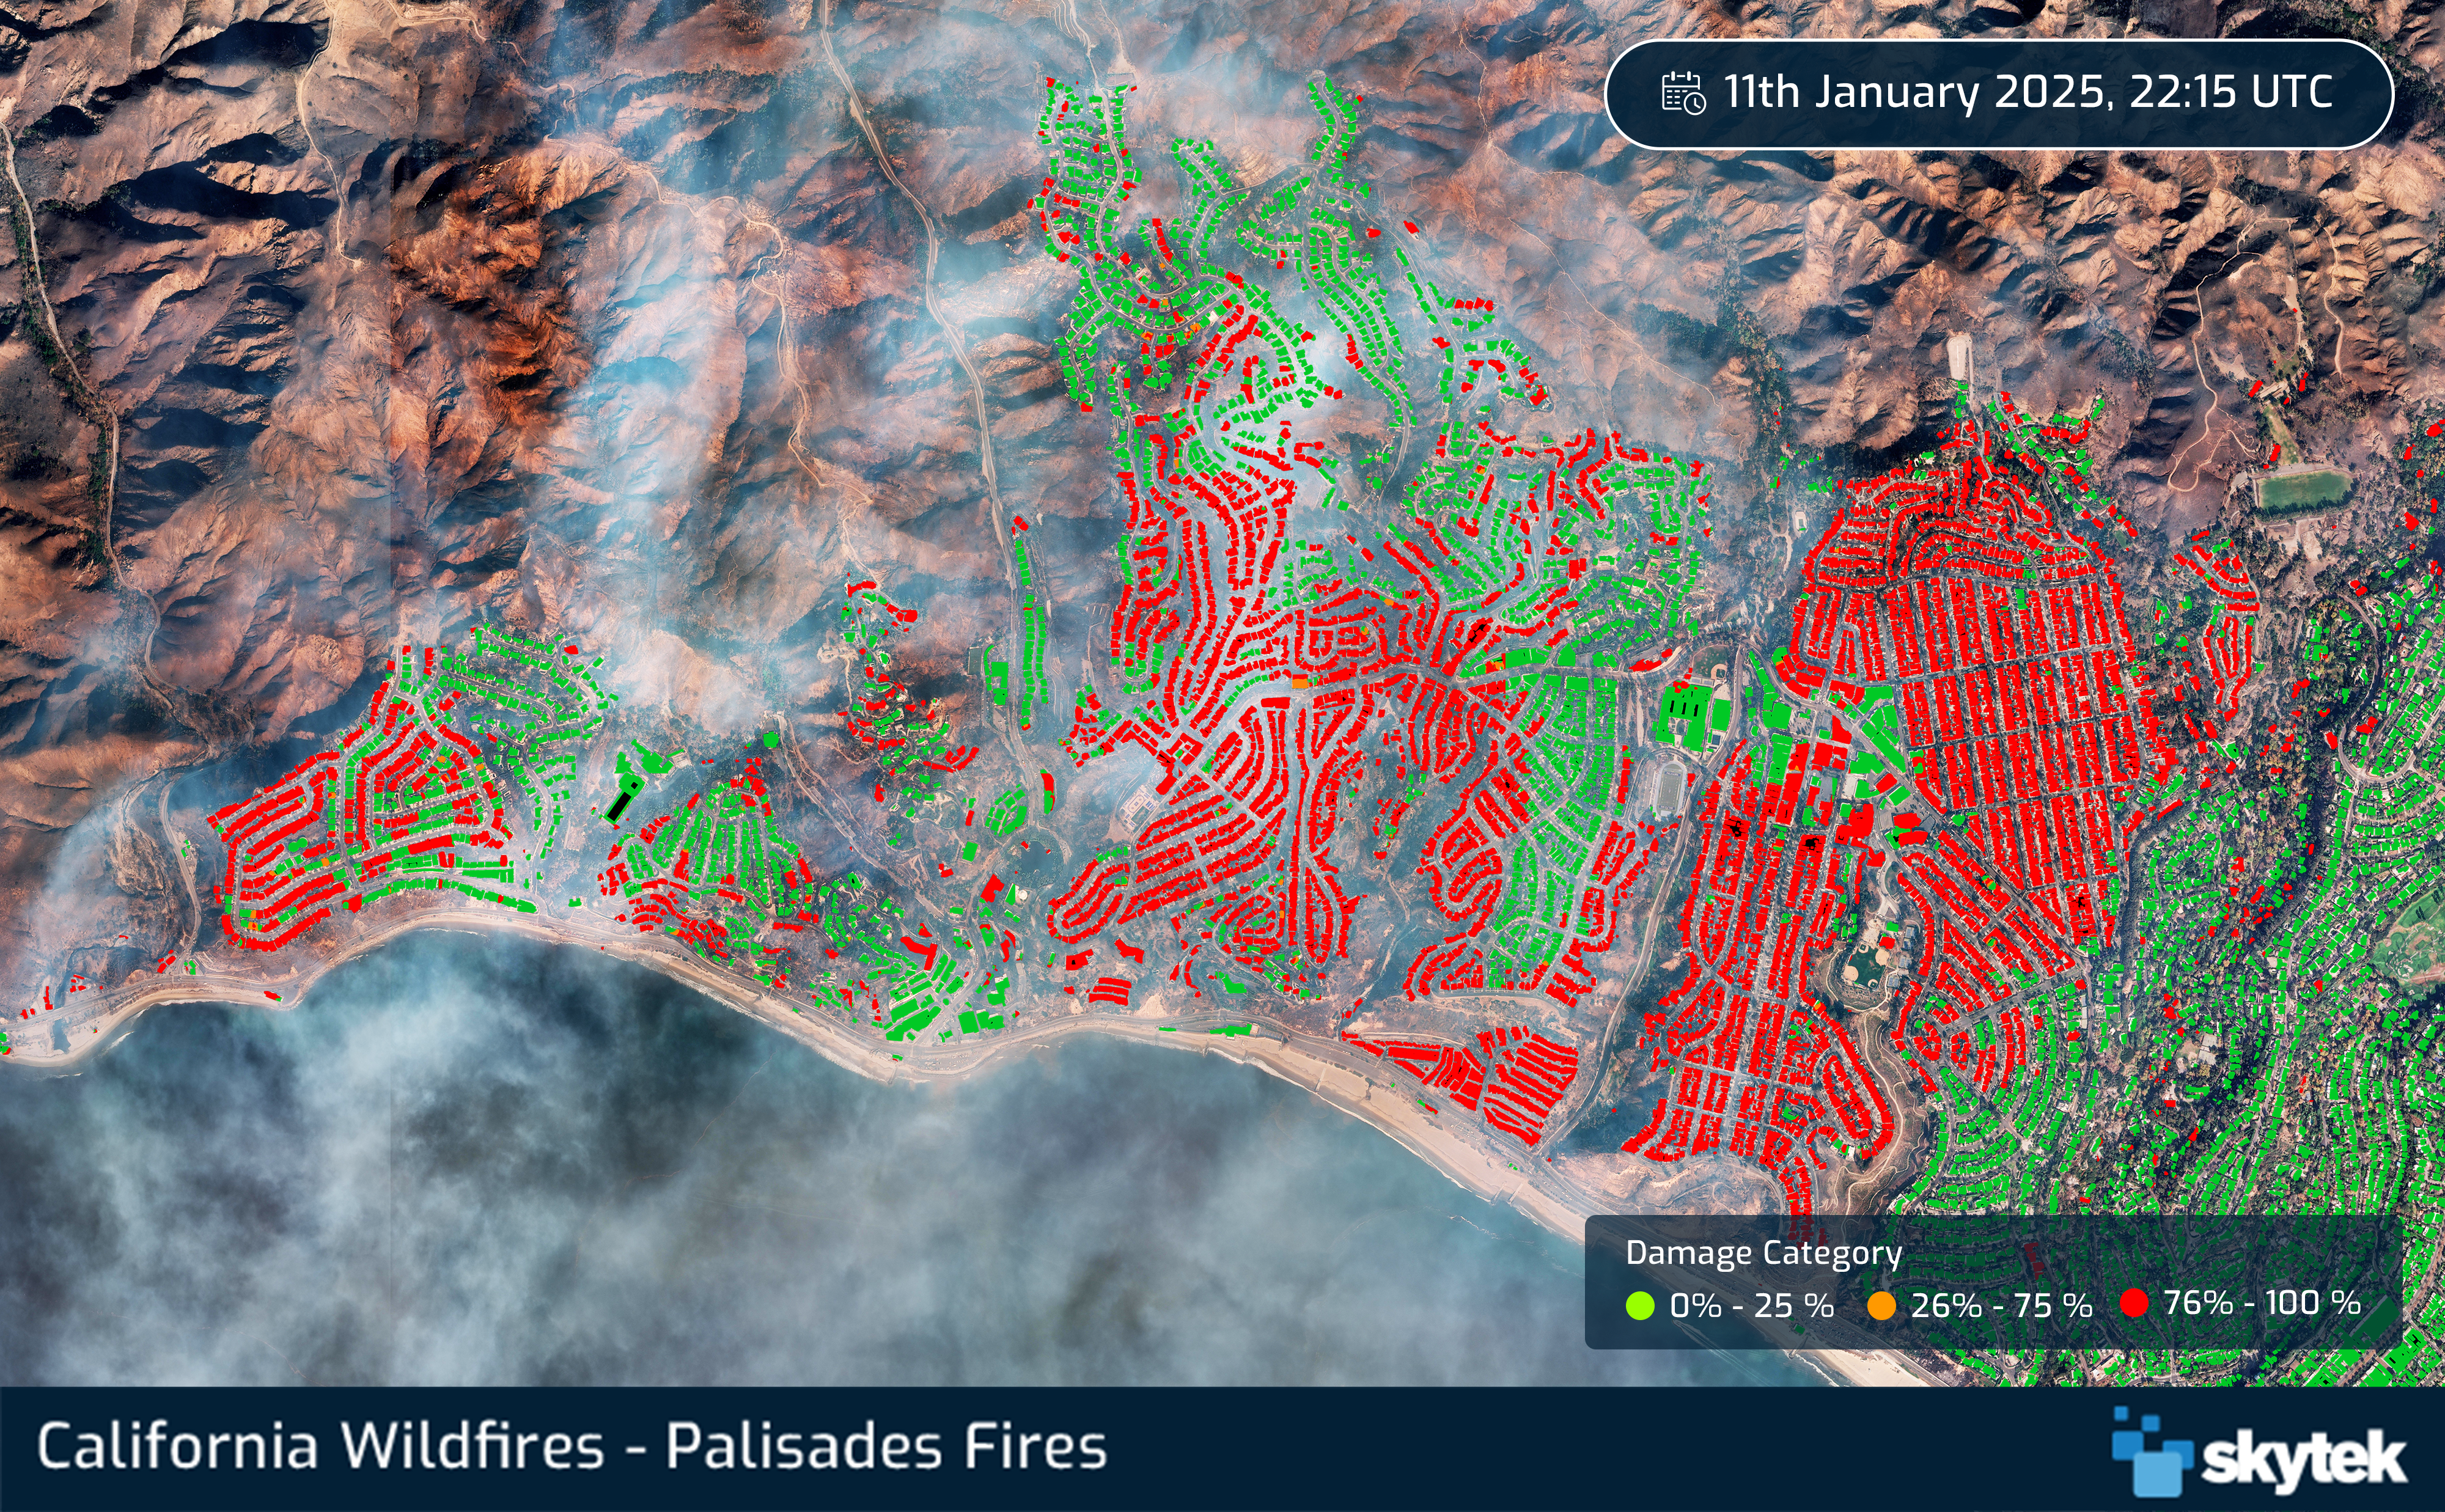
Figure 2 – Satellite imagery of Pacific Palisades on December 01st, 2024.
Figure 3 – Satellite imagery of Pacific Palisades on January 11th, 2025.
Skytek provides two views to support damage assessment
- Macro level: To detect damage over large areas, e.g. city region
- Micro Level: Each property included in the change detection algorithm has a support pre/post image
Macro level:
The damage detection algorithm analyses pre- and post-wildfire imagery to identify property boundaries and generate a damage layer that highlights clusters of affected properties across the entire area of interest. In the Greater Los Angeles area, the Palisades suffered the most significant impact, with approximately 24,000 acres burned, over 5,300 structures destroyed, and an estimated total market value of the damaged properties exceeding $70 billion. Figure 4 illustrates the distribution of damage by category, as identified by Skytek’s proprietary machine learning algorithm after analysing more than 8,550 structures in the Palisades.
Damage Category | Damage Range | Number of Properties | Property Damage % |
 RED | 76% - 100% | 1870 | 21.90% |
 ORANGE | 26% - 75% | 230 | 2.69% |
 GREEN | 0% - 25% | 6439 | 75.41% |
MICRO LEVEL: Individual Properties
Each of the 8,550 analysed properties included above has its own individual pre/post imagery and damage assessment.
The damage score is listed granularly, with each property identified by its coordinates and address. The results of the damage detection model can be visualised in a table, as shown for a sample list of properties in Figure 5 below.
ID | Address | Lat | Long | Damage % | Damage Category |
1 | 34°03'43.7"N | 118°30'17.5"W | 100.00% | RED | |
2 | 34°03'46.5"N | 34°03'46.5"W | 100.00% | RED | |
3 | 16848 Monte Hermoso Dr, Pacific Palisades, CA 90272, USA | 34.0719 N | -118.5545 W | 100.00% | RED |
4 | 15777 Bowdoin St, Pacific Palisades, CA 90272, USA | 34.0478 N | -118.5313 W | 5.20% | RED |
5 | 15308 Sunset Blvd, Pacific Palisades, CA 90272, USA | 34.0473 N | -118.5263 W | 98.57% | RED |
6 | 16940 Sunset Blvd, Pacific Palisades, CA 90272, USA | 34.0420 N | -118.5474 W | 100.00% | RED |
7 | 1842 Palisades Dr, Pacific Palisades, CA 90272, USA | 34.0750 N | -118.5588 W | 100.00% | RED |
8 | 17026 Avenida De Santa Ynez, Pacific Palisades, CA 90272, USA | 34.0726 N | -118.5586 W | 100.00% | RED |
9 | 17137 Avenida De Santa Ynez, Pacific Palisades, CA 90272, USA | 34.0699 N | -118.5592 W | 0.00% | GREEN |
10 | 1273 Palisades Dr, Pacific Palisades, CA 90272, USA | 34.0697 N | -118.5617 W | 100.00% | RED |
11 | 1142 Las Pulgas Rd, Pacific Palisades, CA 90272, USA | 34.0527 N | -118.5382 W | 77.95% | RED |
12 | 1170 Galloway St, Pacific Palisades, CA 90272, USA | 34.0513 N | -118.5218 W | 100.00% | RED |
13 | 14400 Villa Woods Pl, Pacific Palisades, CA 90272, USA | 34.0520 N | -118.5137 W | 100.00% | RED |
14 | 18125 Coastline Dr, Malibu, CA 90265, USA | 34.0434 N | -118.5707 W | 94.06% | RED |
15 | 15120 Sunset Blvd, Pacific Palisades, CA 90272, USA | 34.0447 N | -118.5241 W | 75.28% | RED |
16 | 111 Marquez Pl, Pacific Palisades, CA 90272, USA | 34.0412 N | -118.5489 W | 100.00% | RED |
17 | 17002 Sunset Blvd, Pacific Palisades, CA 90272, USA | 34.0410 N | -118.5505 W | 100.00% | RED |
18 | 16801 Pacific Coast Hwy, Pacific Palisades, CA 90272, USA | 34.0404 N | -118.5455 W | 0.00% | RED |
19 | 14800 W Pampas Ricas Blvd, Pacific Palisades, CA 90272, USA | 34.0407 N | -118.5185 W | 100.00% | RED |
20 | 14820 W Pampas Ricas Blvd, Pacific Palisades, CA 90272, USA | 34.0406 N | -118.5188 W | 0.00% | GREEN |
21 | 603 Hightree Rd, Santa Monica, CA 90402, USA | 34.0380 N | -118.5169 W | 0.00% | GREEN |
22 | 15200 W Friends St, Pacific Palisades, CA 90272, USA | 34.0337 N | -118.5273 W | 100.00% | RED |
For each property, an individual report is available that details the damage identified by the machine learning (ML) algorithm, supported by high-resolution imagery for in-depth analysis to assist with claims evaluation. As examples, reports for the properties located at 1601 San Onofre Dr, Pacific Palisades and 1790 Alta Mura Rd, Pacific Palisades are included in this documentation.


