Hurricane Ian – Update Report

Summary:

This report provides an update to the information about the ongoing situation of Hurricane Ian, as previously published by Skytek on September 27th, 2022.

The latest forecast provides an updated trajectory for this hurricane, with a clear shift to the East by comparison with the initial forecast.

Skytek continues to actively monitor the evolving situation in the areas potentially affected by Hurricane Ian, which is now confirmed to be a Category 4 with winds reaching 140 mph and expected to make landfall on Wednesday at 2PM EDT.  The recent shift puts in danger a significant number of merchant vessels and yachts sailing in the Savannah and Charleston Port area (see Figure 1).

Skytek detected 73 commercial vessels with an estimated value of $3 Billion and two onshore windfarms located in Appalachian State and Flagler County.

Using its REACT platform, Skytek provides an overview of the exposure, in the form of a list of assets currently in the cone of the Hurricane as well as a graphical view on the map (Figure 1).

Type of assets

No.

Cargo vessels

68

Tanker Vessels

5

Yachts

Hotels

198

Windfarm

2

Figure 1: Graphical representation of exposure in the cone of hurricane Ian – Cone source @ NOAA.

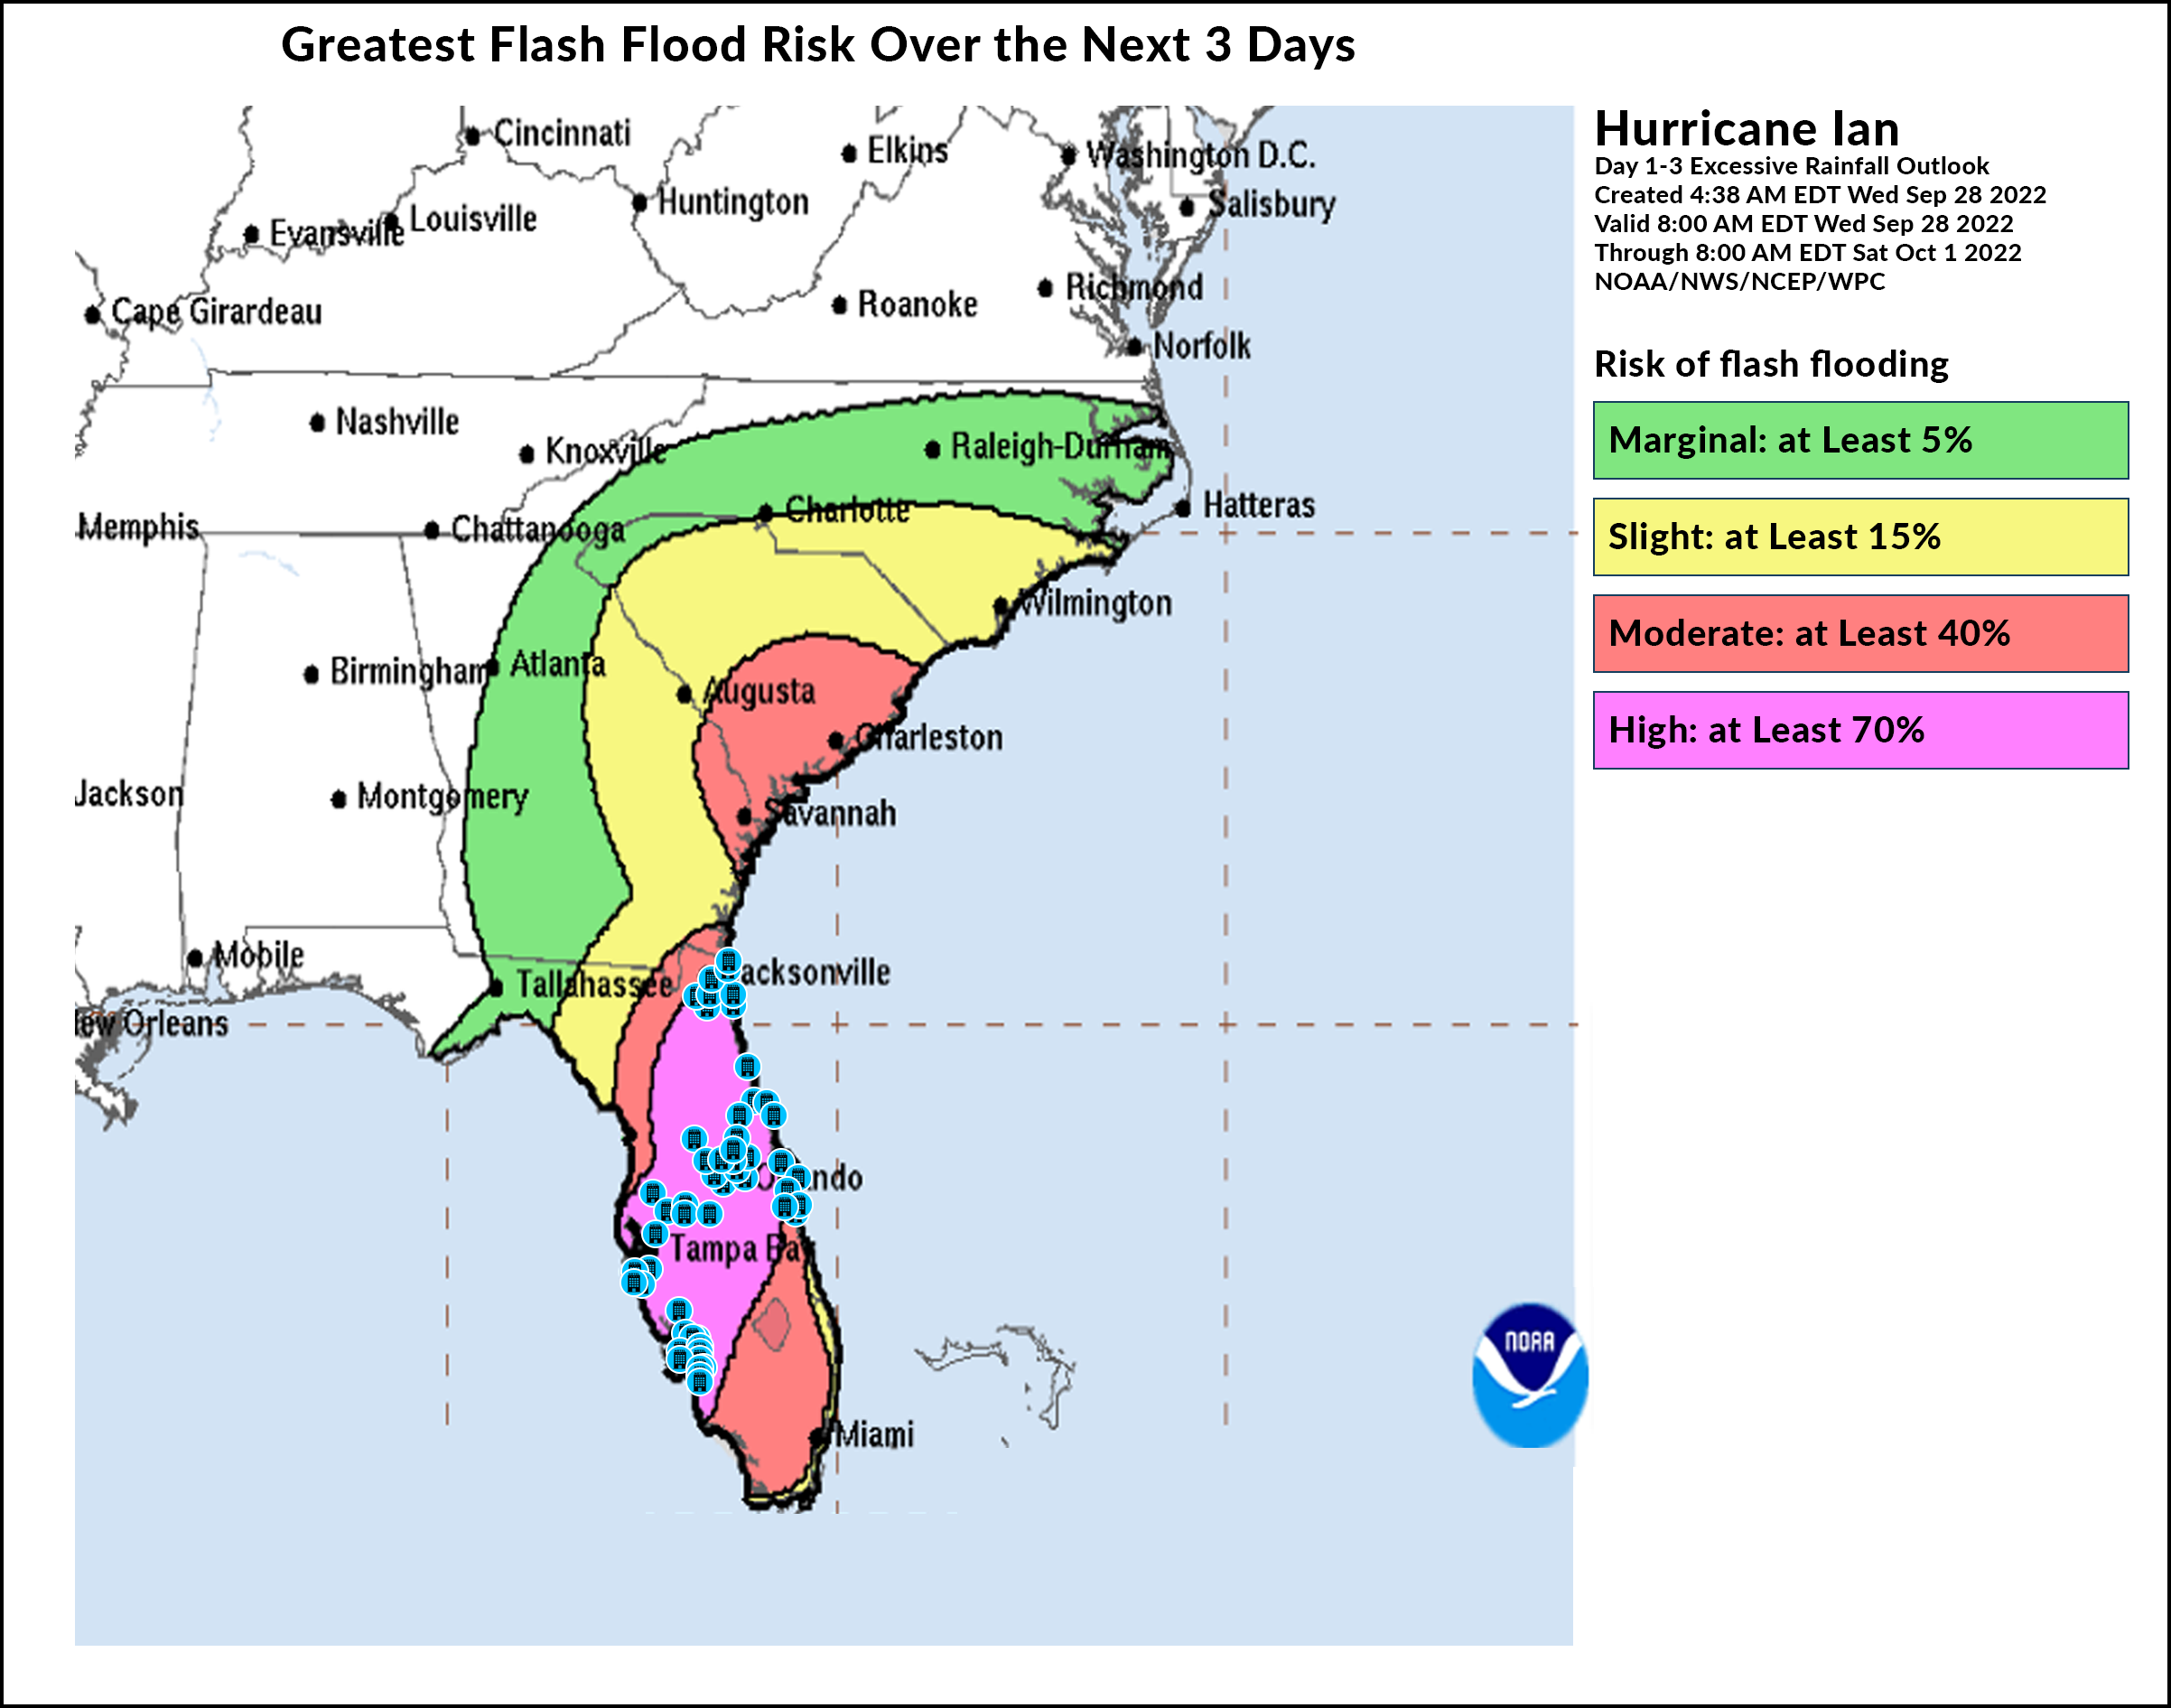
FLASH FLOODS, RAIN AND FLOODING PREDICTIONS

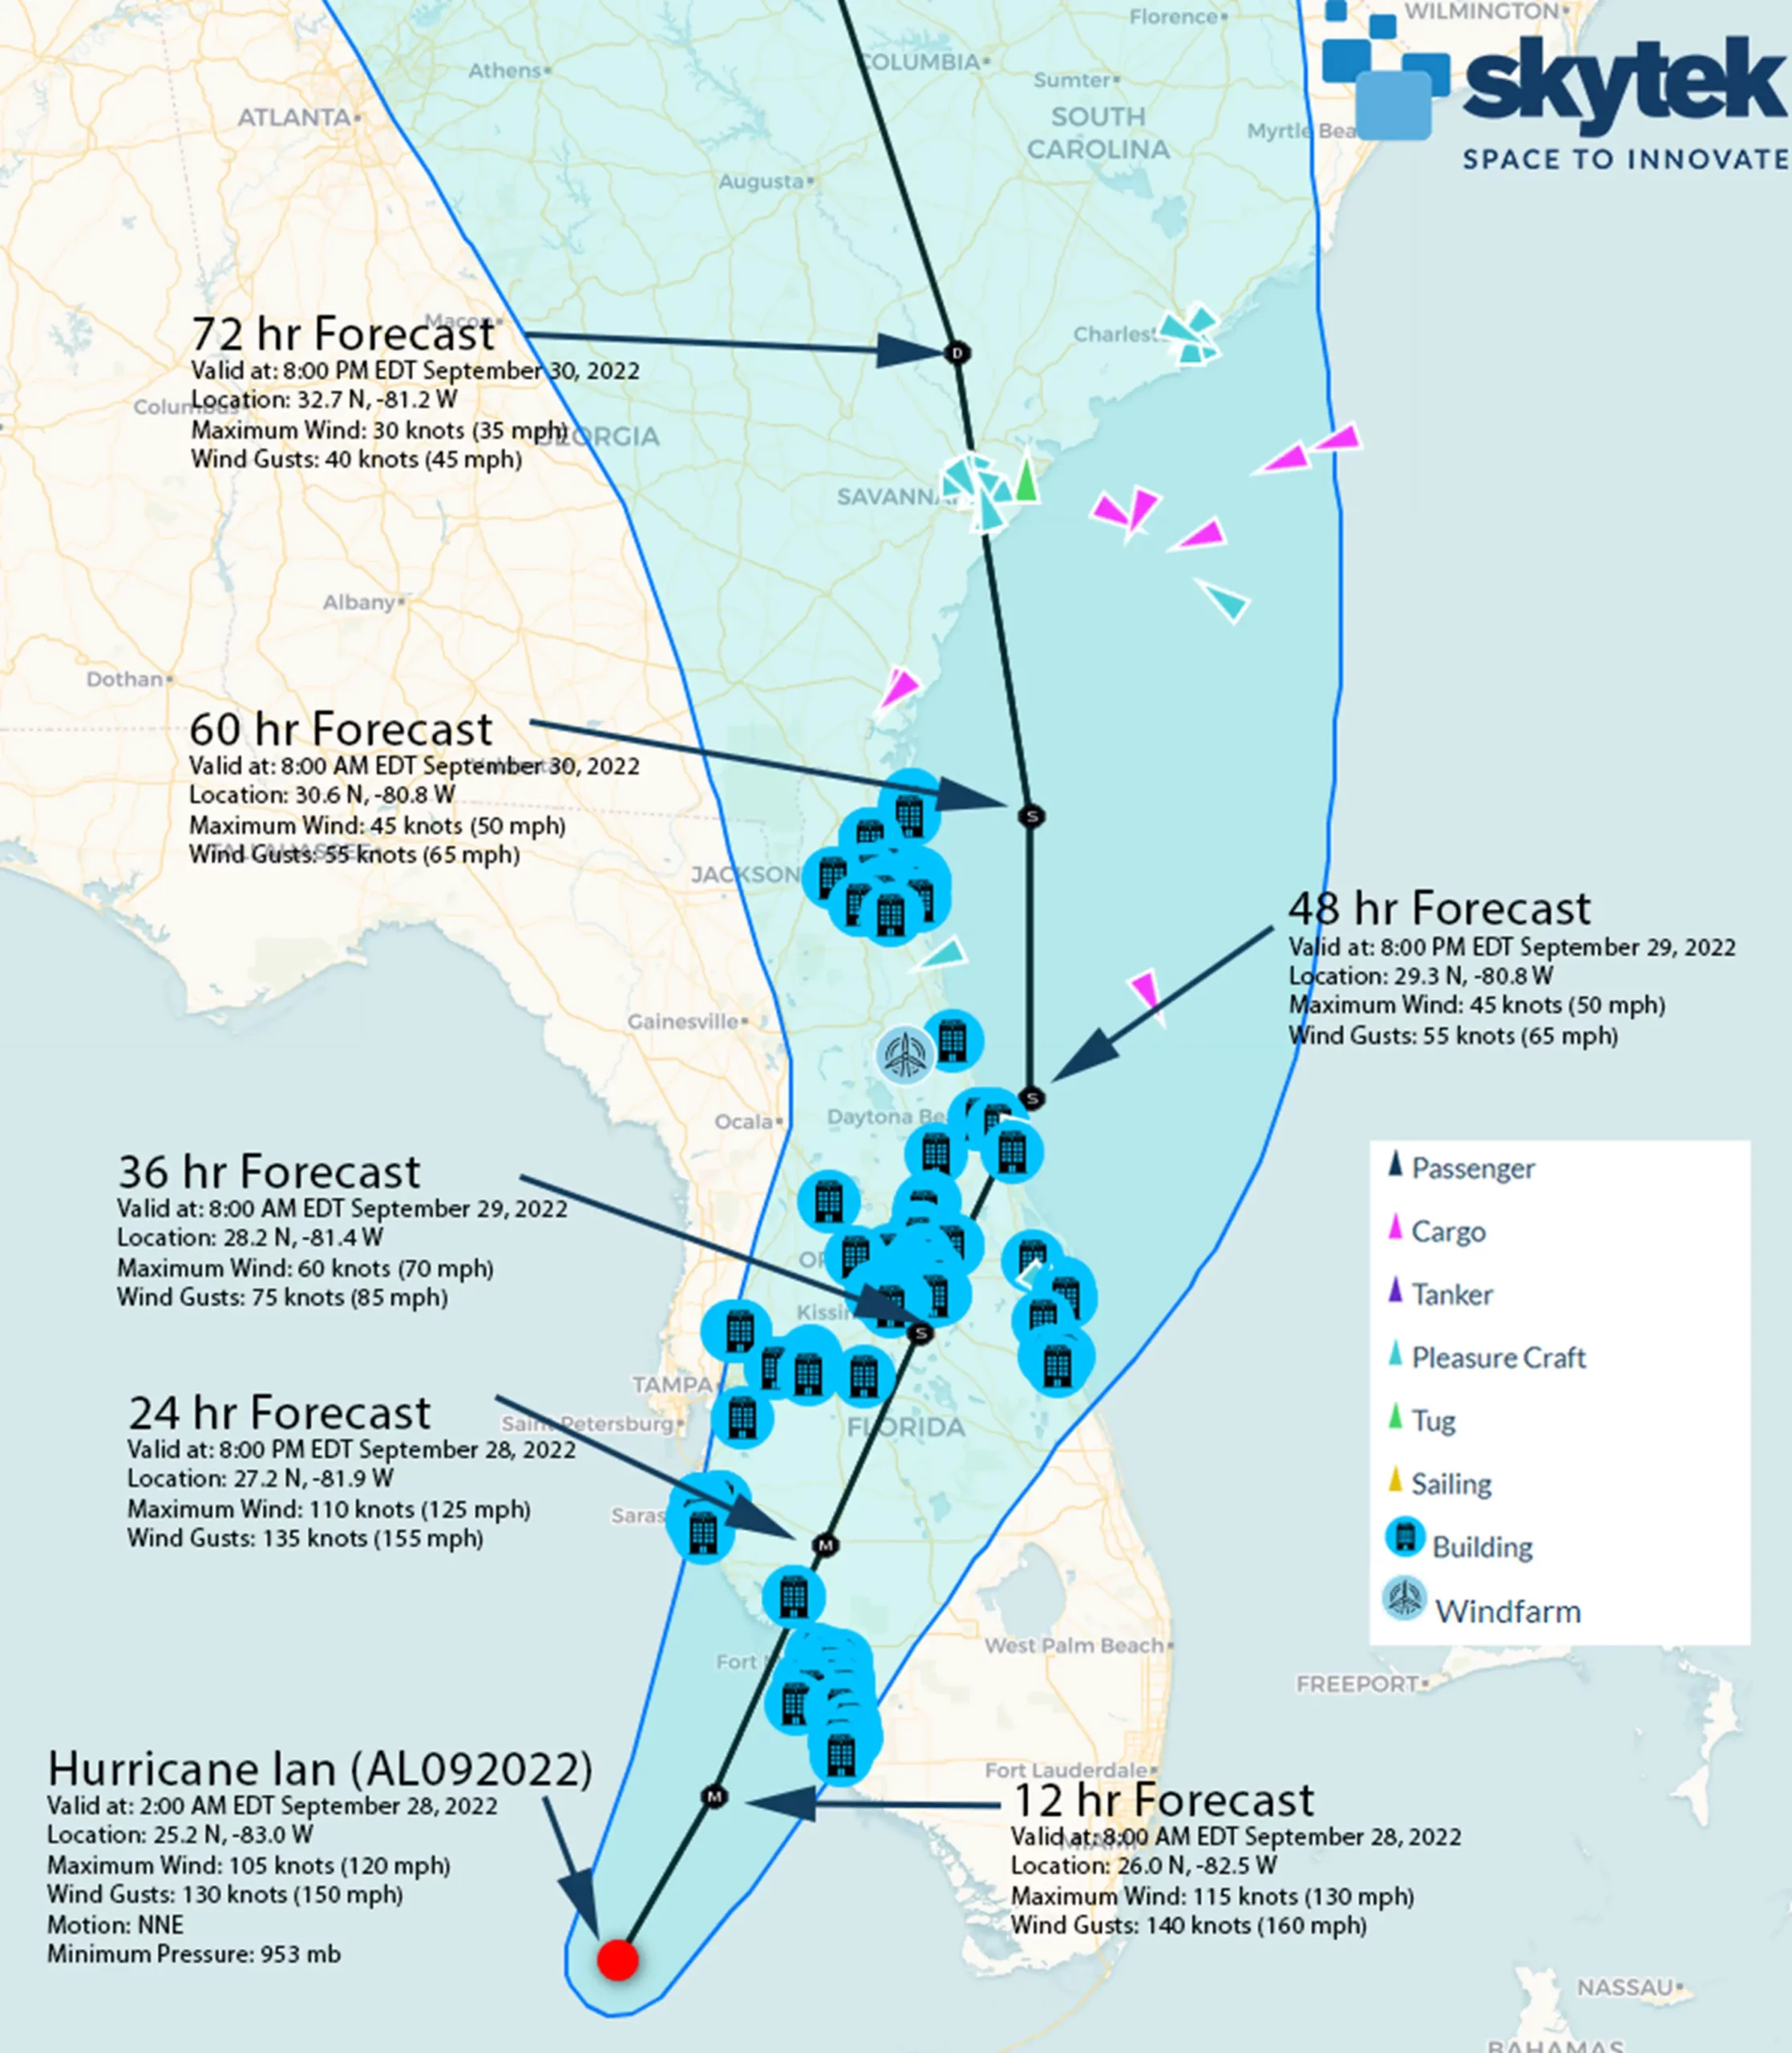
Currently, Hurricane Ian is expected to make landfall on Wednesday, September 28th, 2022, at 2PM EDT over Florida between Venice and Fort Myers, but changes to these details are possible.

While monitoring the event, Skytek considers all potential sources of data and information, to provide a most up-to-date and accurate picture of the potential losses that will result from this catastrophic event.

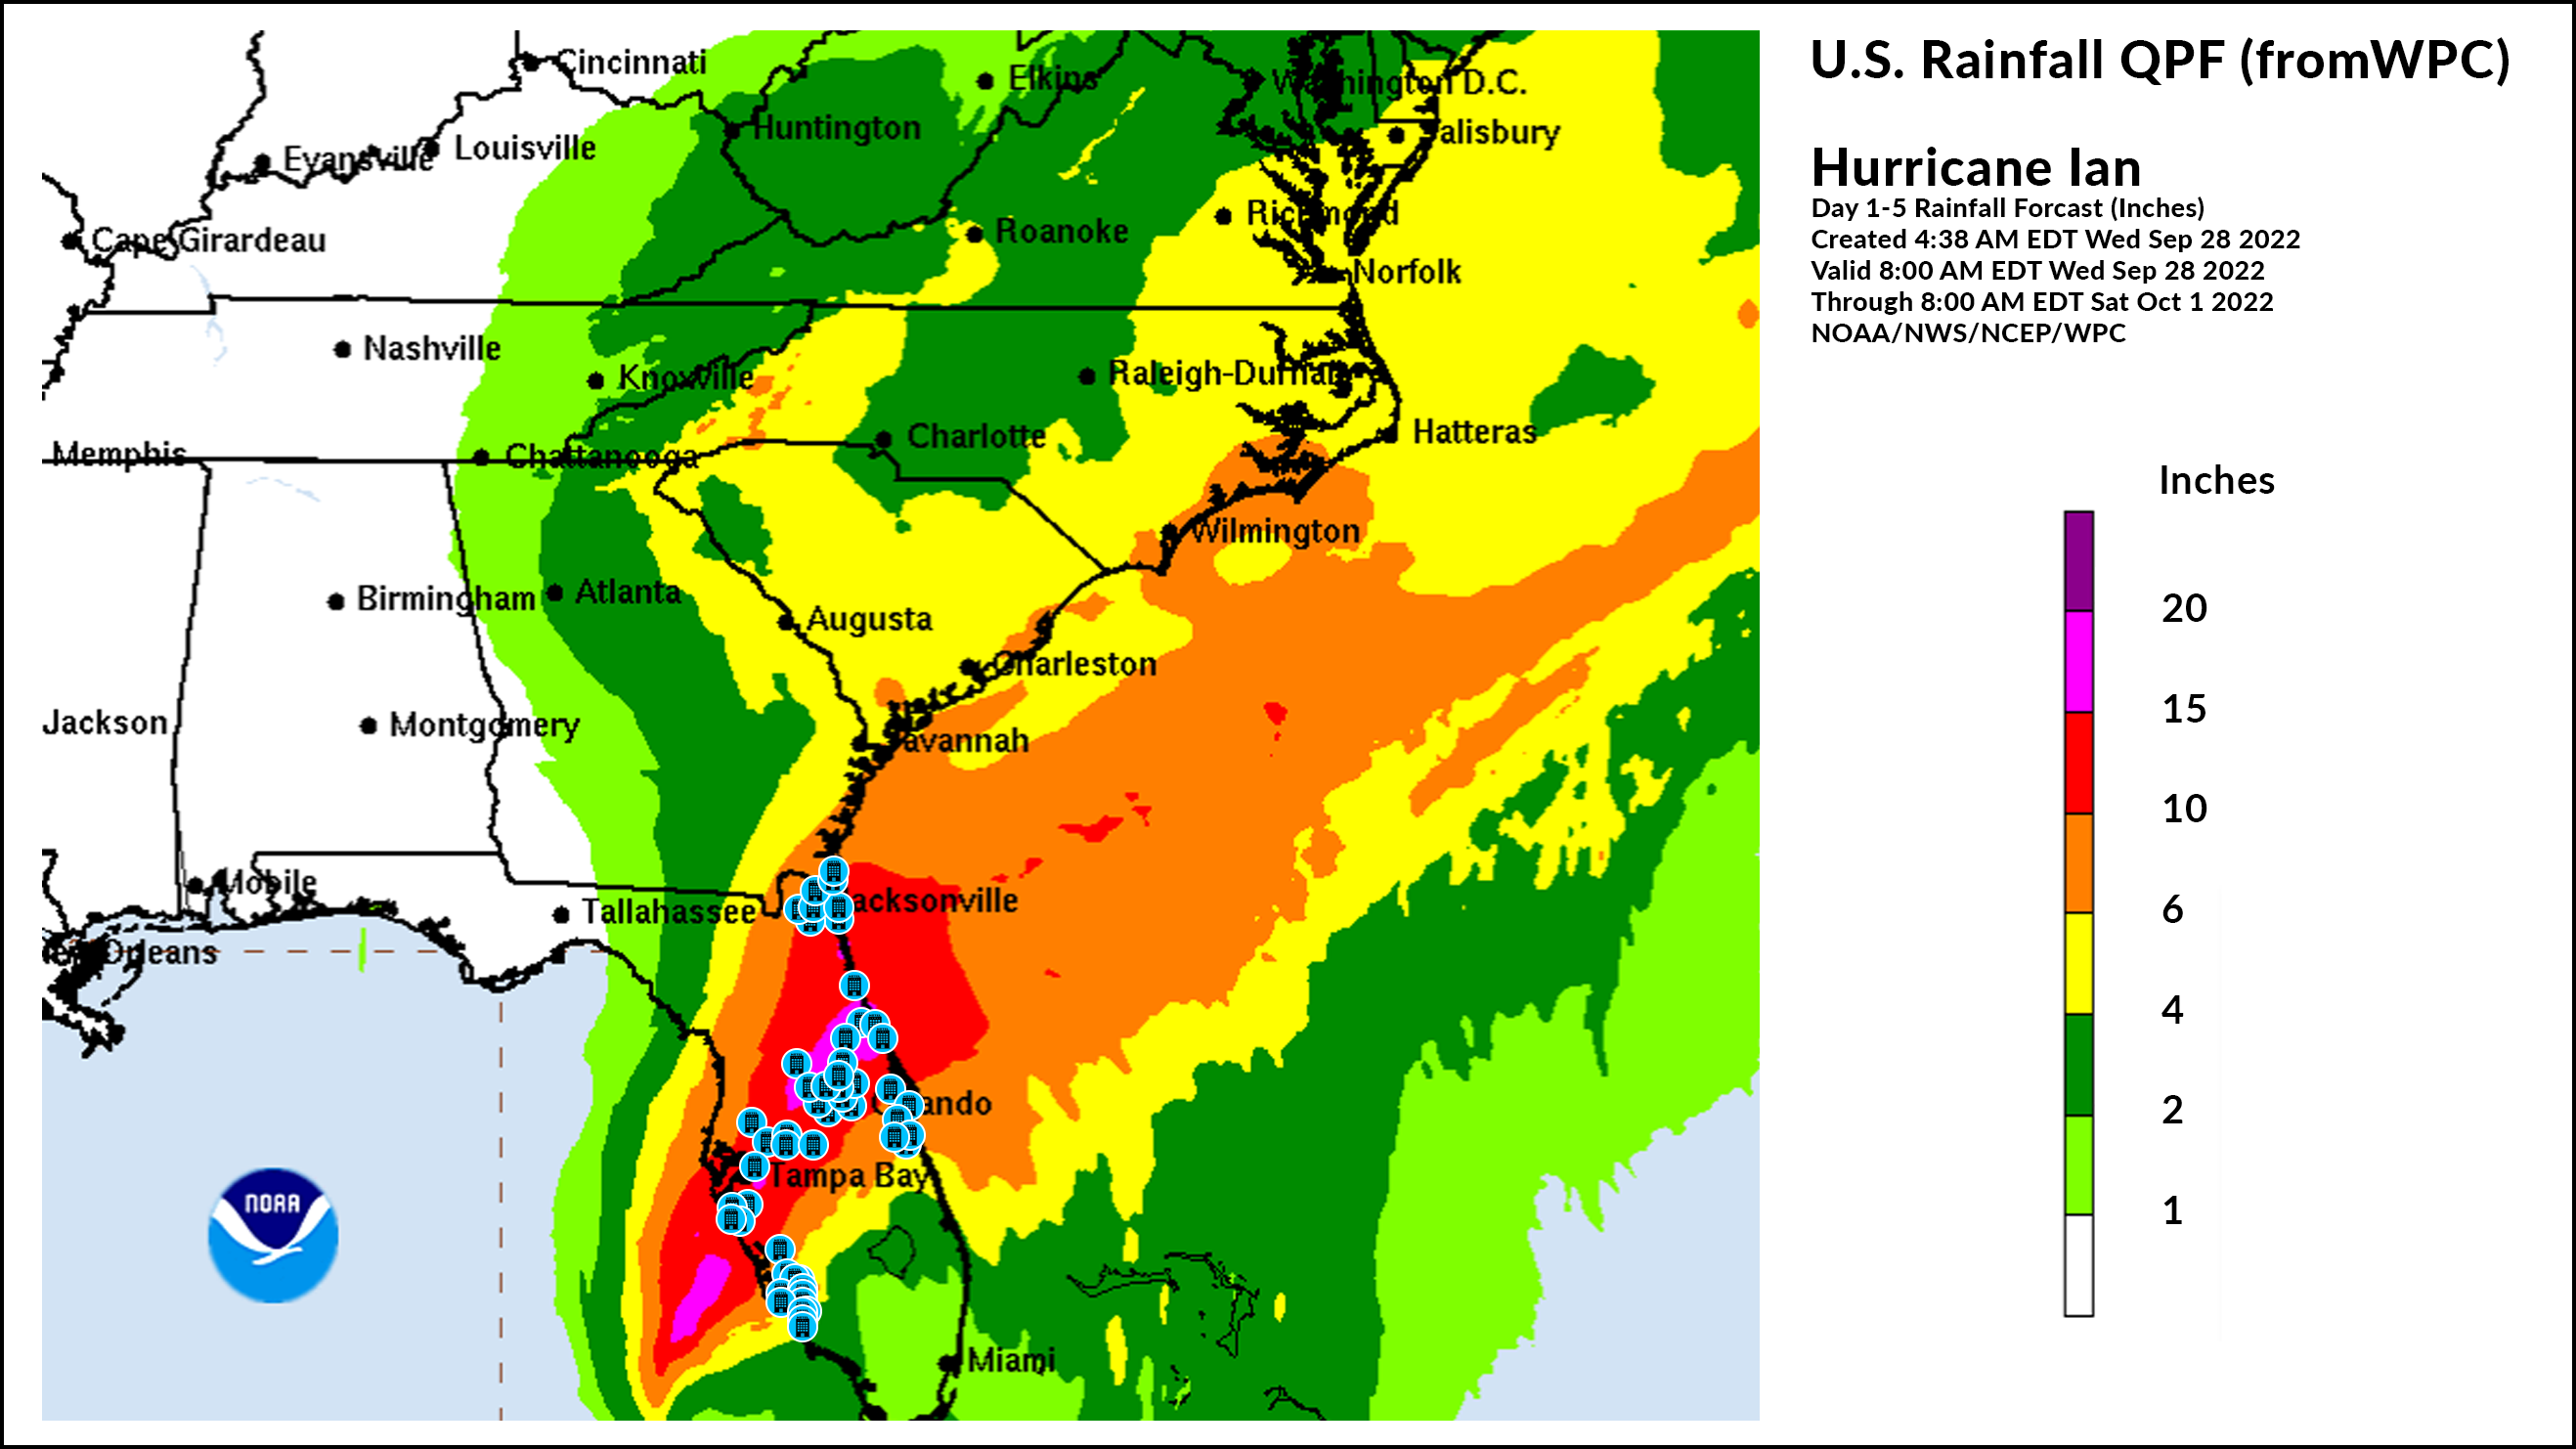
The following figures, provide up-to-date maps and information about important parameters in the estimate of losses: potential storm surge flooding, flash floods probability and level of rainfall (in inches).

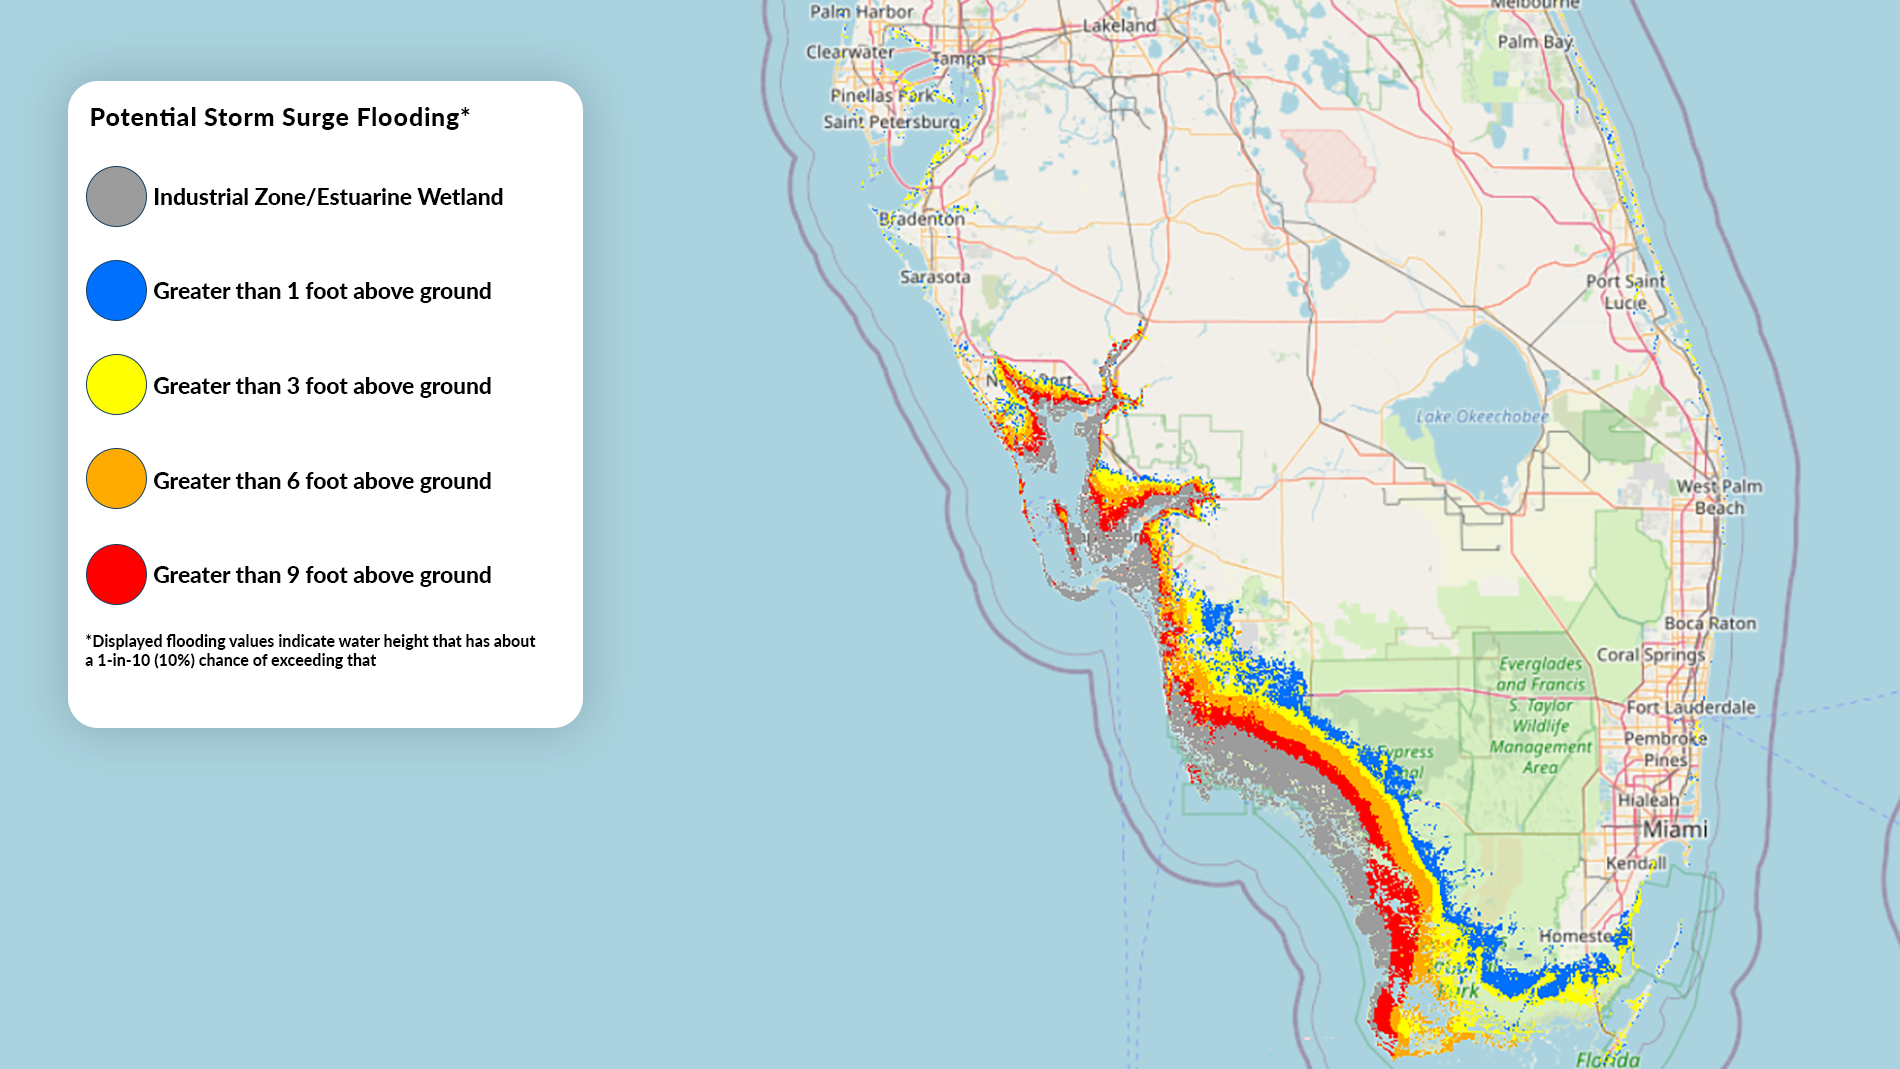
Figure 2 below provides a map with levels (in feet above ground level) of potential storm surge flooding on the East coast of Florida

Figure 2: Potential storm surge flood levels on the East coast of Florida

Figure 3 provides a map view of the areas with the highest probability of flash floods, Tampa and Orlando, and a sample of the luxury hotels within this high probability region:

Figure 3: Excessive Rainfall Outlooks - credits @ NWS/NCEP Weather Prediction Center (WPC).

Figure 4 shows the concentration of luxury hotels in the area where the highest level of rainfall (between 15 and 20 inches) is expected in the next 3 days, between Tampa Bay and Jacksonville:

Figure 4: Rainfall potential - credits @ NWS/NCEP Weather Prediction Center (WPC) .

PORTS AND OFFSHORE EXPOSURE

Skytek is actively monitoring the main ports in the area, procuring pre-event satellite images and planning the tasking of post-event satellite data to provide an accurate picture of the damage caused by Hurricane Ian post landfall.

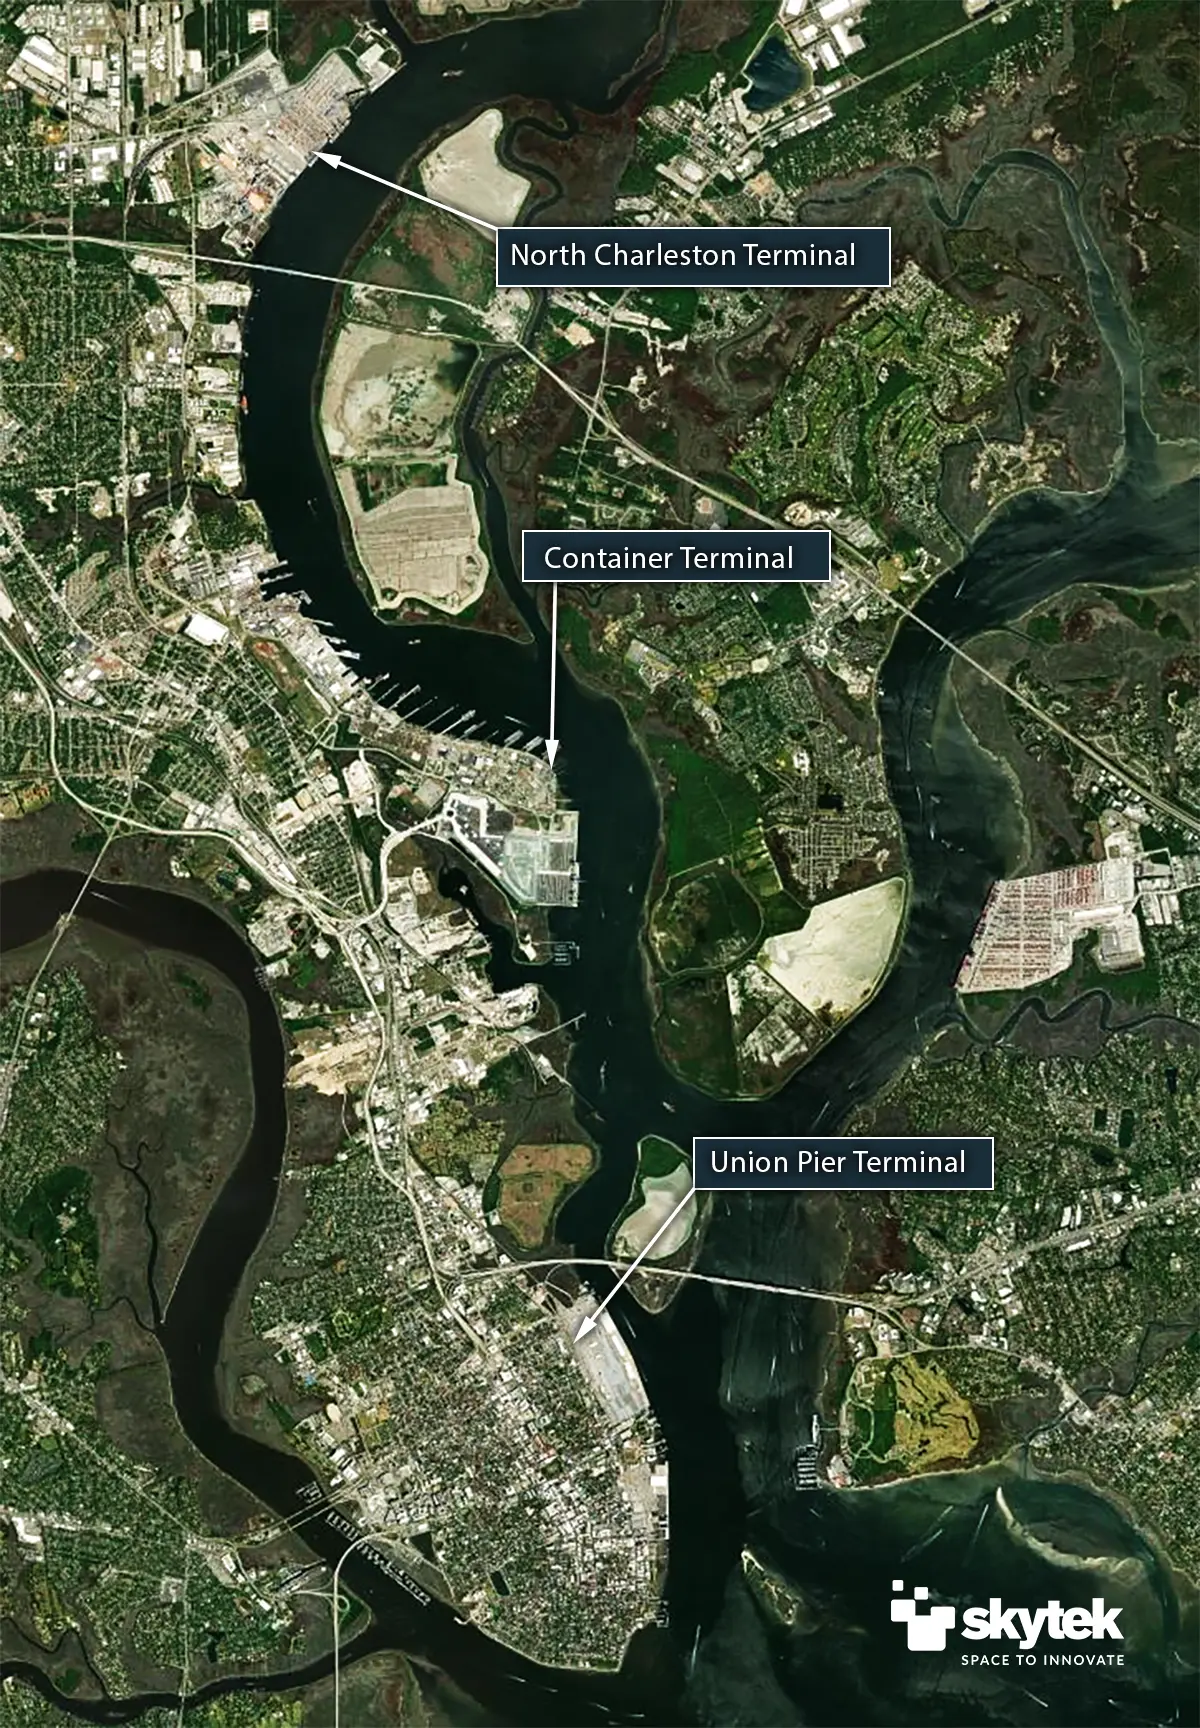
The Port of Tampa, with a handling capacity of 33 million tons of cargo a year, is spread over 5,000 acres and operates an average of ~2,700 vessels per year.

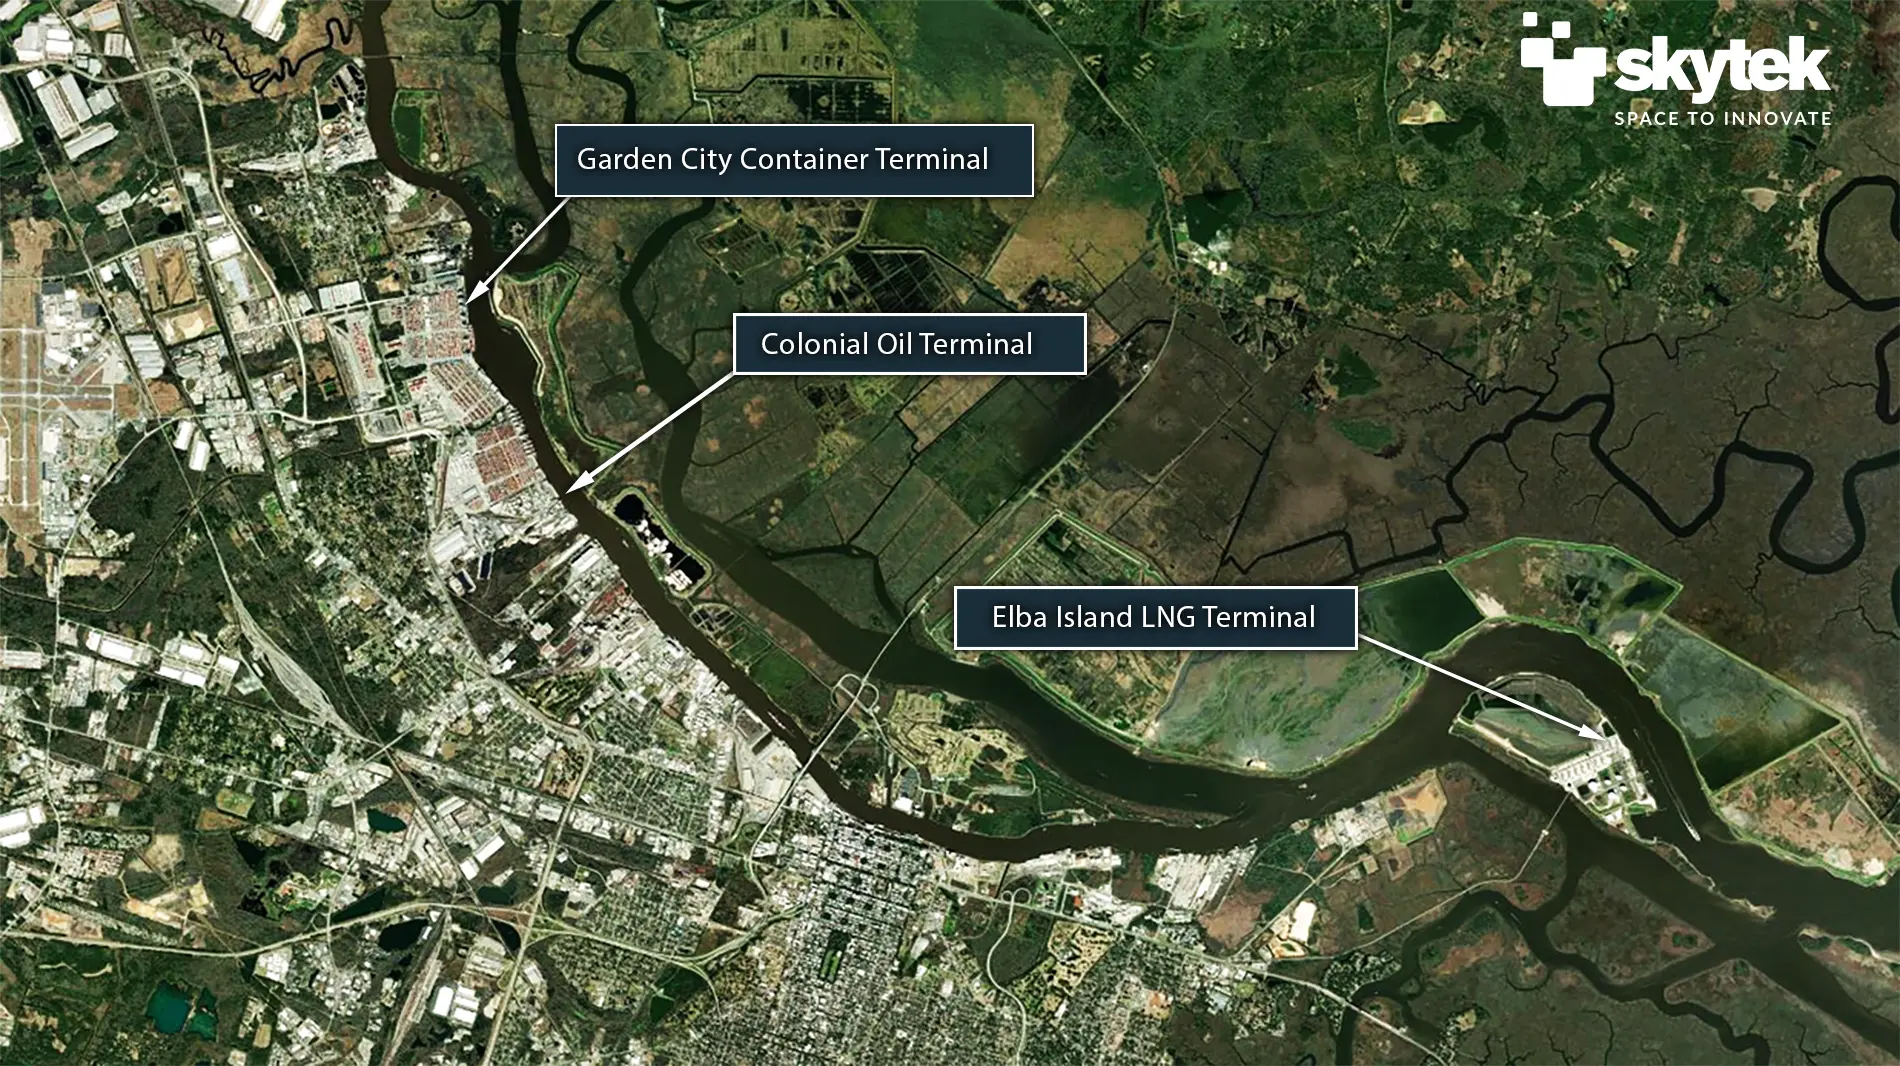
Figure 5 below provides an overview of the main port areas of interest and terminals in the Port of Tampa.

Figure 5: Overview of Tampa Port and its areas and terminals.

Port of Charleston is ranked as the 6th port in the United States by cargo value, with over $72 billion in imports and exports traded across the docks. In 2021, the Port of Charleston handled 2.55 million twenty-foot equivalent container units  

Figure 6 below provides an overview of the main port areas of interest and terminals.

The Port of Savannah is the third-busiest container gateway in the US, operating 41 Mil Tonnes of cargo in 2021.  

Figure 7 below provides an overview of the main port areas of interest and terminals. 

Figure 6: Overview of Charleston Port and its areas and terminals.
Figure 7: Port of Savannah and its areas and terminals.

YACHT AND PLEASURE BOAT EXPOSURE

Port Charlotte is on the path of the Hurricane eye, and it is home to several marinas with many yachts and pleasure boats.


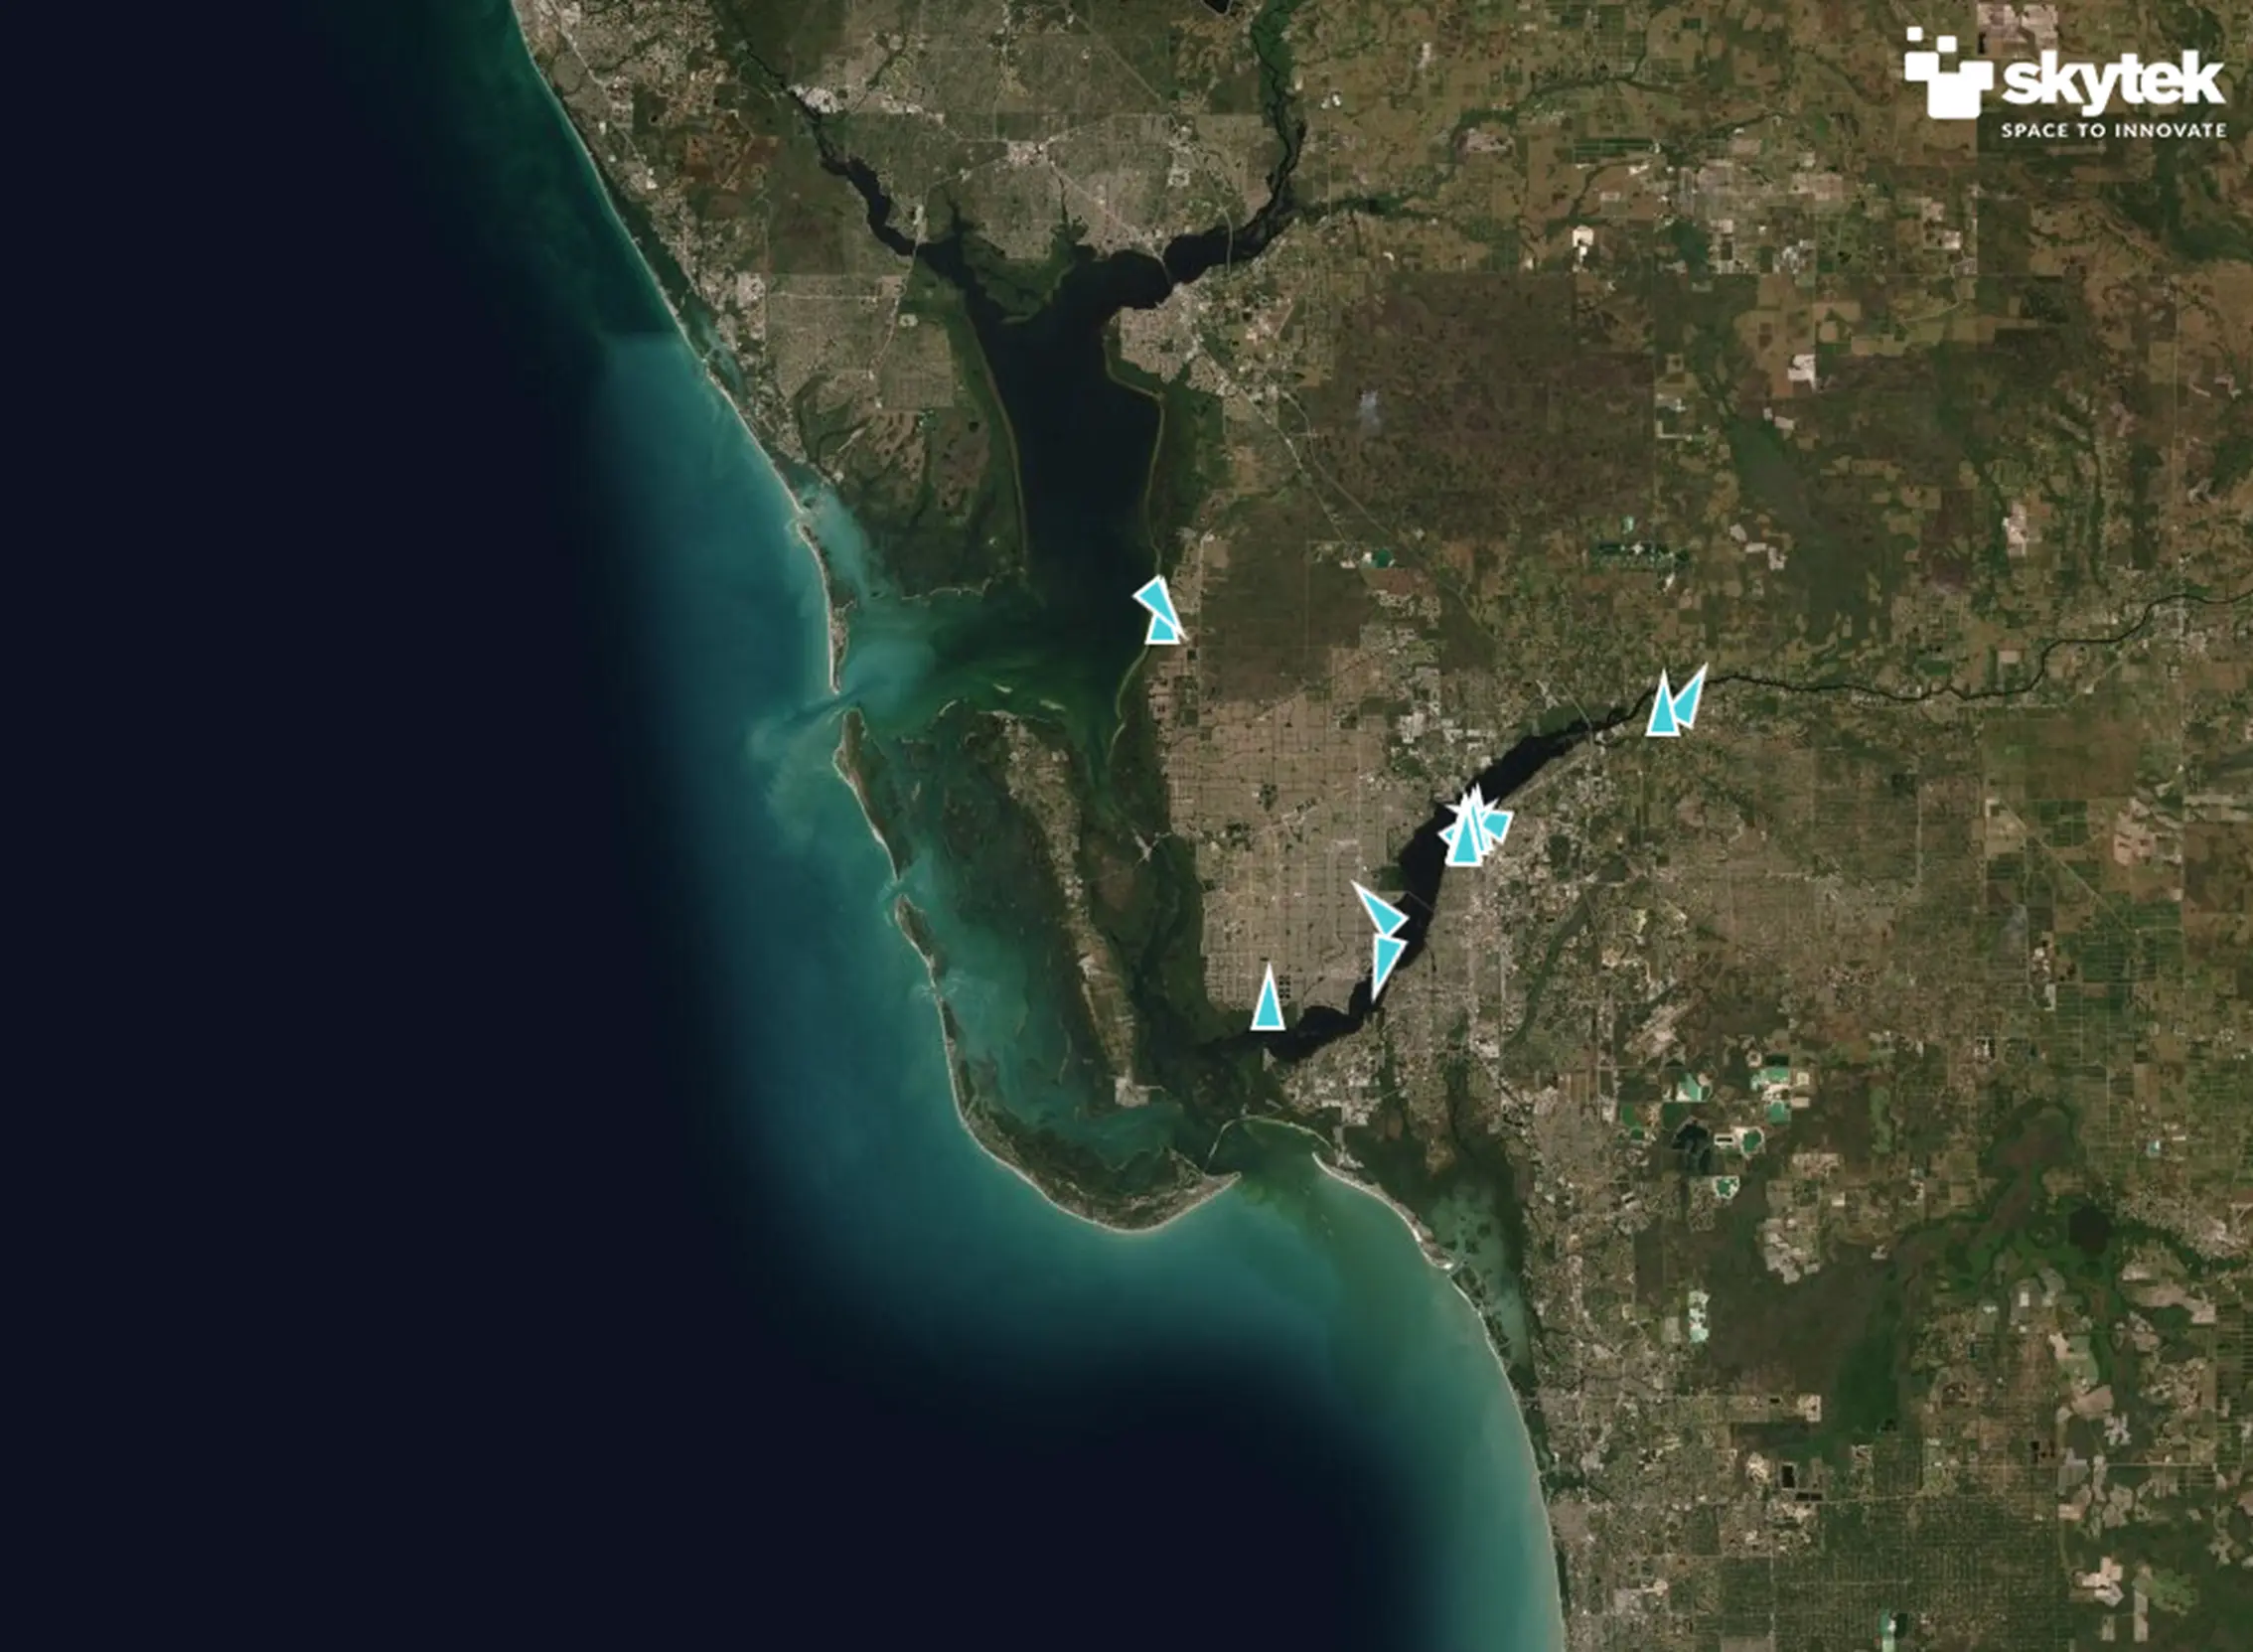
Skytek’s REACT system captured 20 yachts with active AIS trackers suggesting high-value yachts in this area. In addition, using satellite Earth Observation imagery acquired this week, Skytek’s satellite club system identified numerous small vessels in the area, suggesting significant yacht exposure.

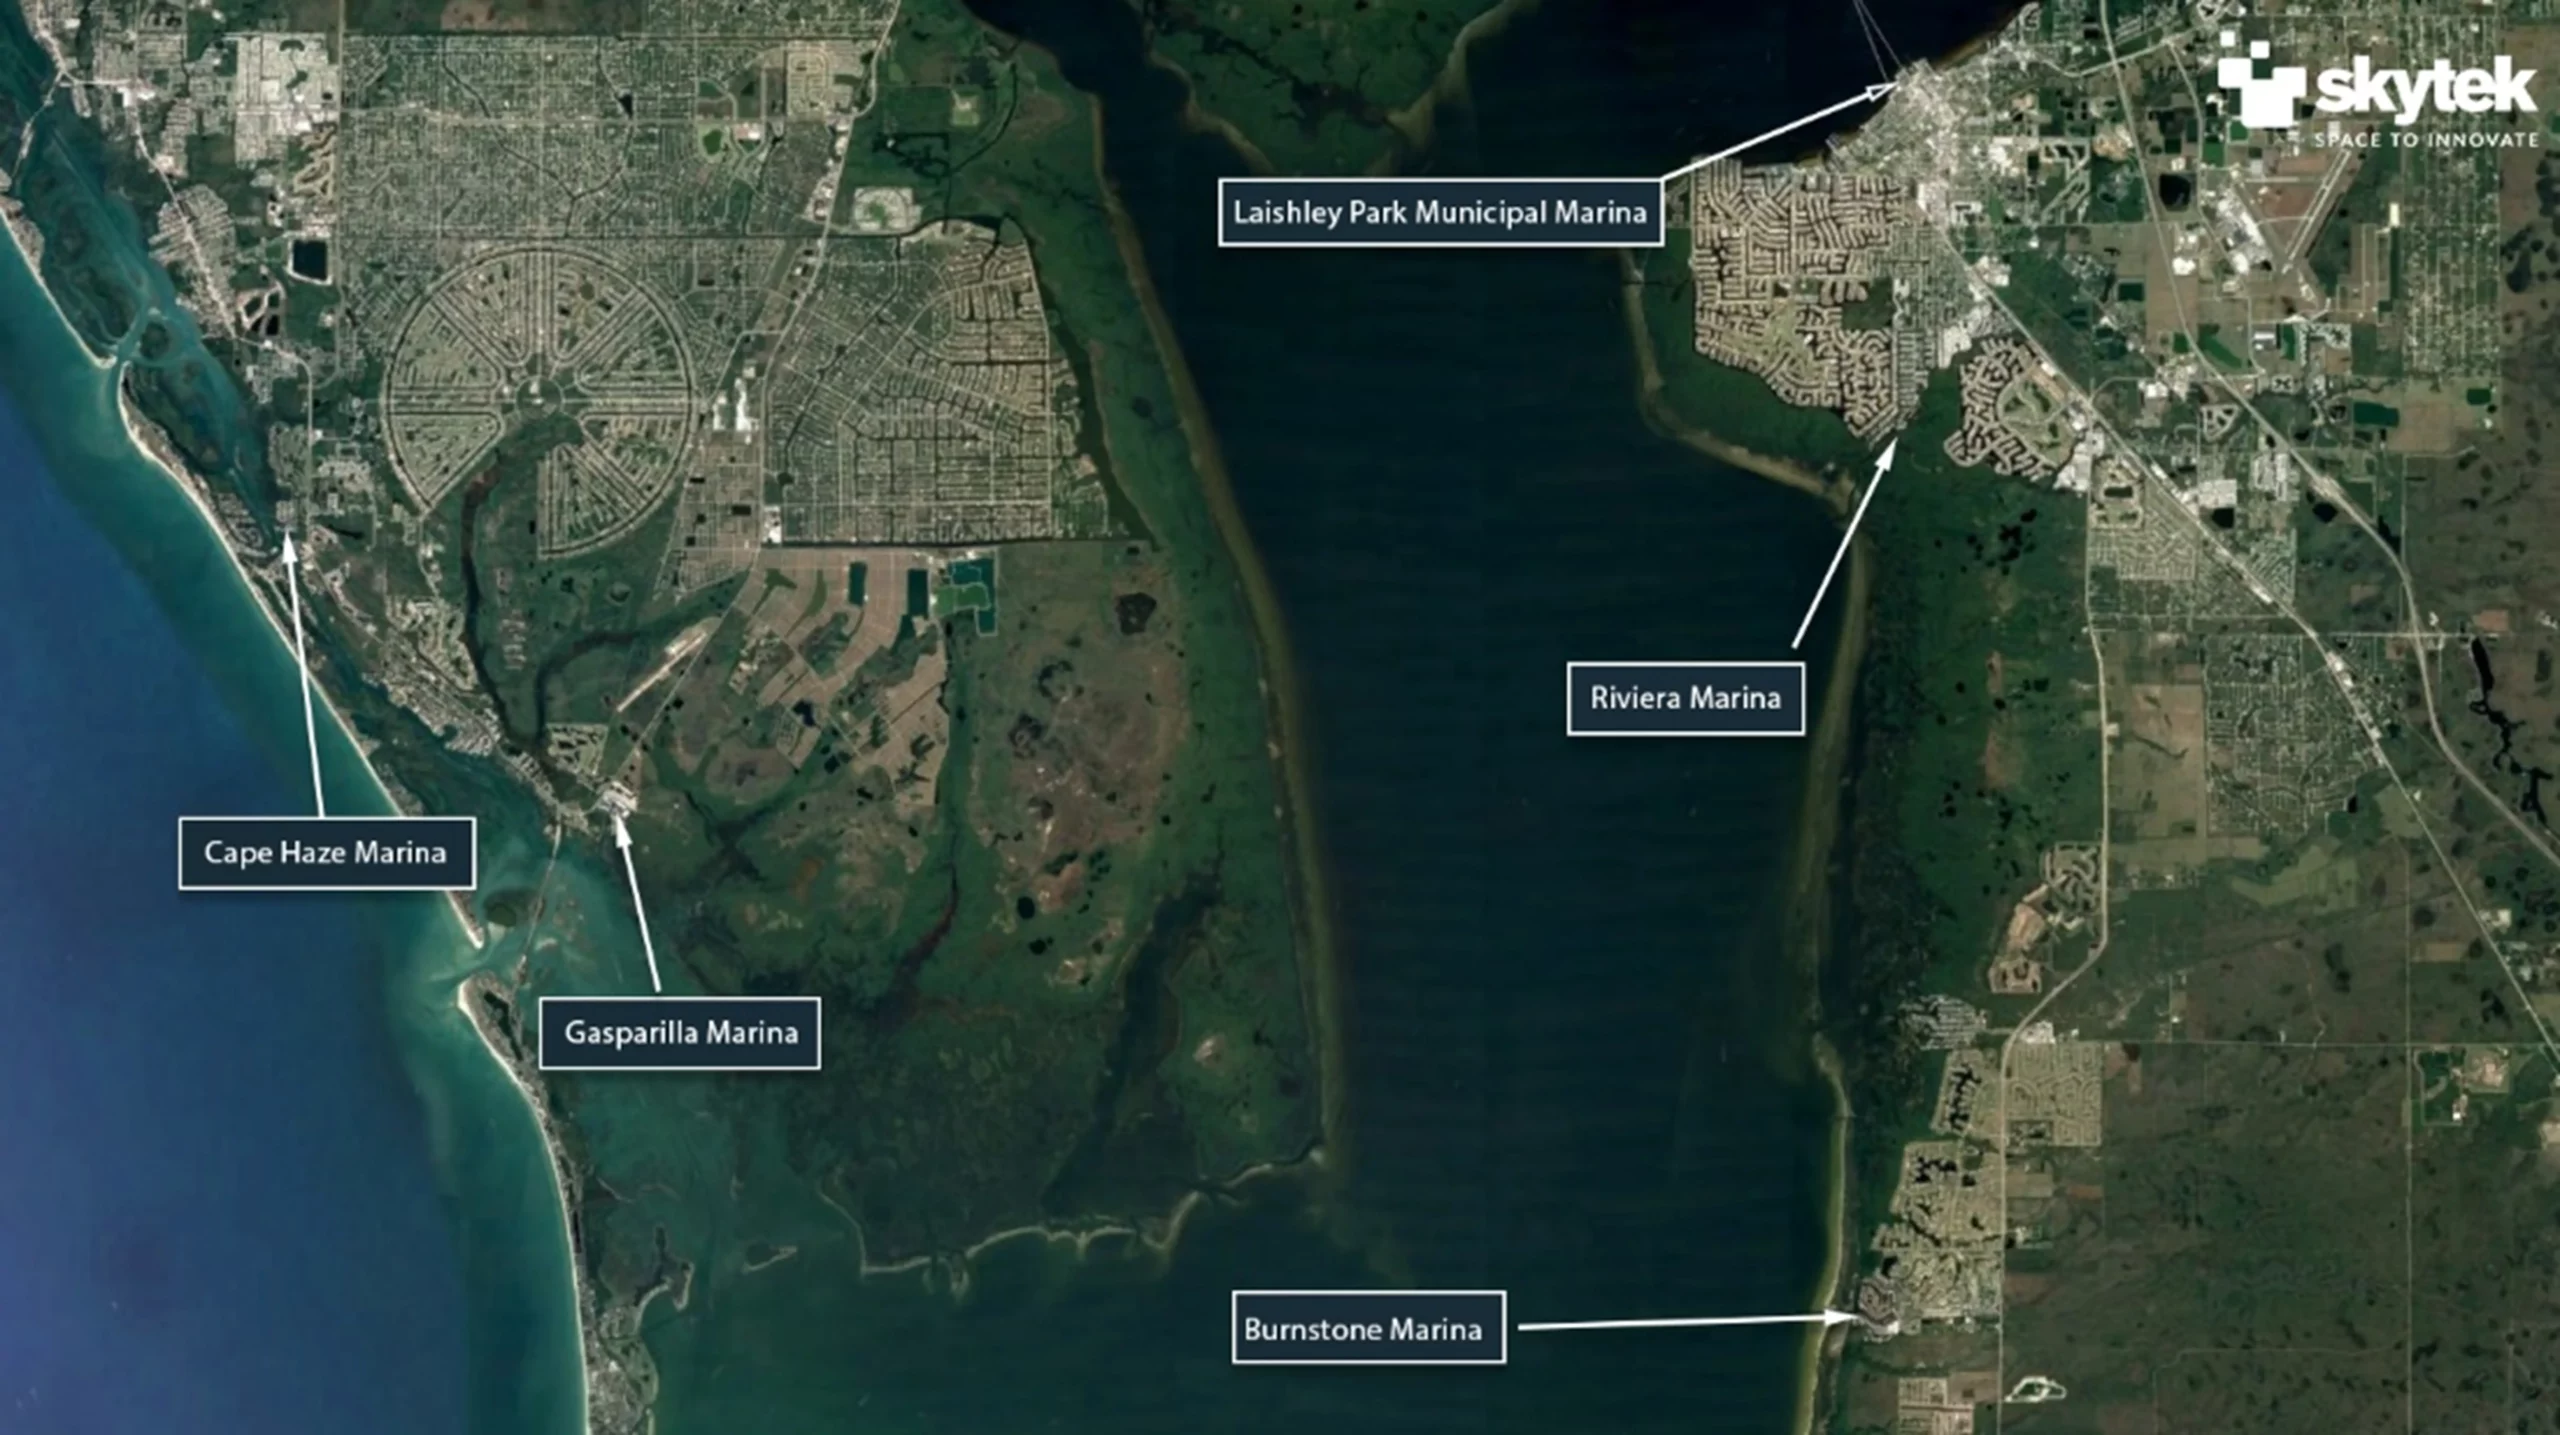
The top 5 marinas exposed to Hurricane Ian in the area are listed below and plotted in the map in Figure 8:  

  1. Laishley Park Municipal Marina
  2. Riviera marina
  3. Gasparilla Marina
  4. Cape Haze Marina
  5. Burnstone Marina
Figure 8: Top 5 marinas in Port Charlotte.

Using very high-resolution Earth Observation images, Skytek is able to provide in-depth and up-to-date information about the status of the assets within these marinas, as well as the condition of the infrastructure around them. An example is provided in Figure 9 below, for the “Burnstone Maina” in Port Charlotte, Florida.

Figure 9: A satellite image of Burnstore Marina acquired earlier this month.

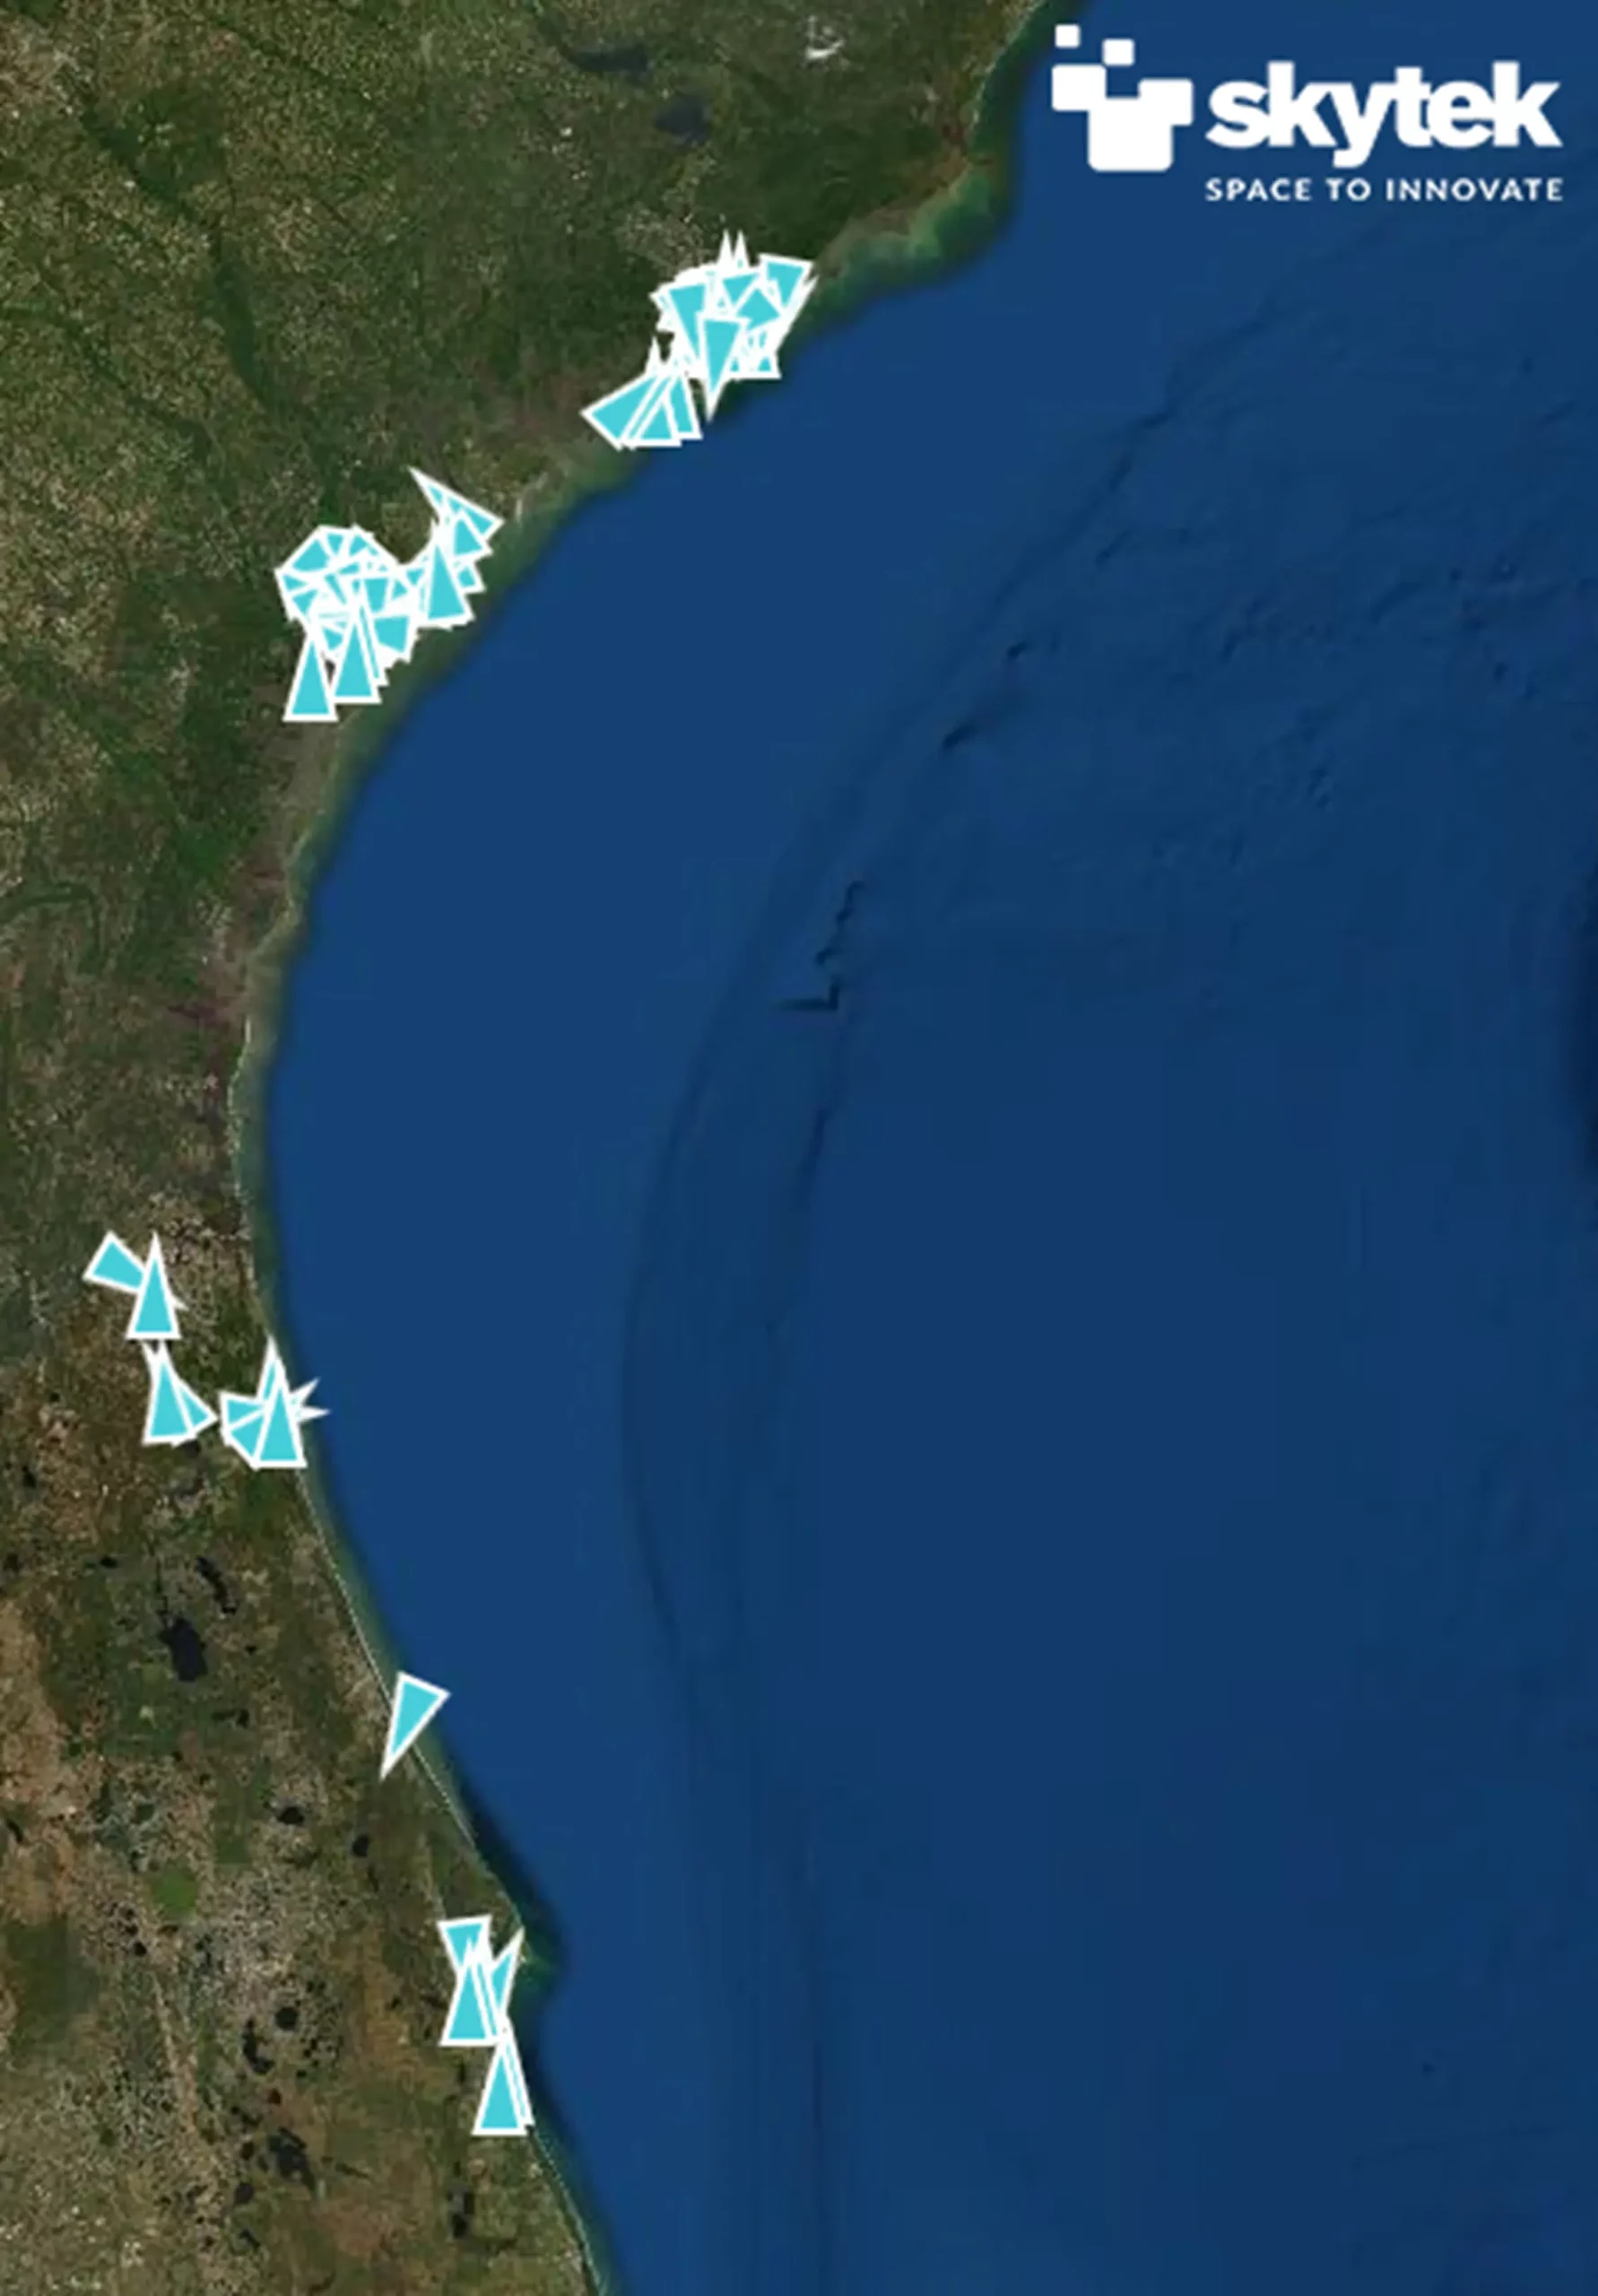
Skytek’s REACT platform captures high-value yachts on the two coastal areas that are expected to be affected by Hurricane Ian in the next hours. These are mapped in Figures 10 and 11 below, for the West and the East part of the Florida coast:

Figure 10: High-value yachts captured by Skytek’s REACT Platform on the West coast of the Florida peninsula.
Figure 11: High value yachts captured by Skytek’s REACT Platform on the East coast of the Florida peninsula.

PROPERTY AND INFRASTRUCTURE EXPOSURE

The current forecasts predicts that Hurricane Ian will make landfall, as a Category 4 hurricane, on Wednesday, September 28th, 2022, at 2 PM EDT over Florida between Venice and Fort Myers. A significant number of high-value properties and infrastructures are located in this region, including hotels, theme parks, and airports.

HOTELS

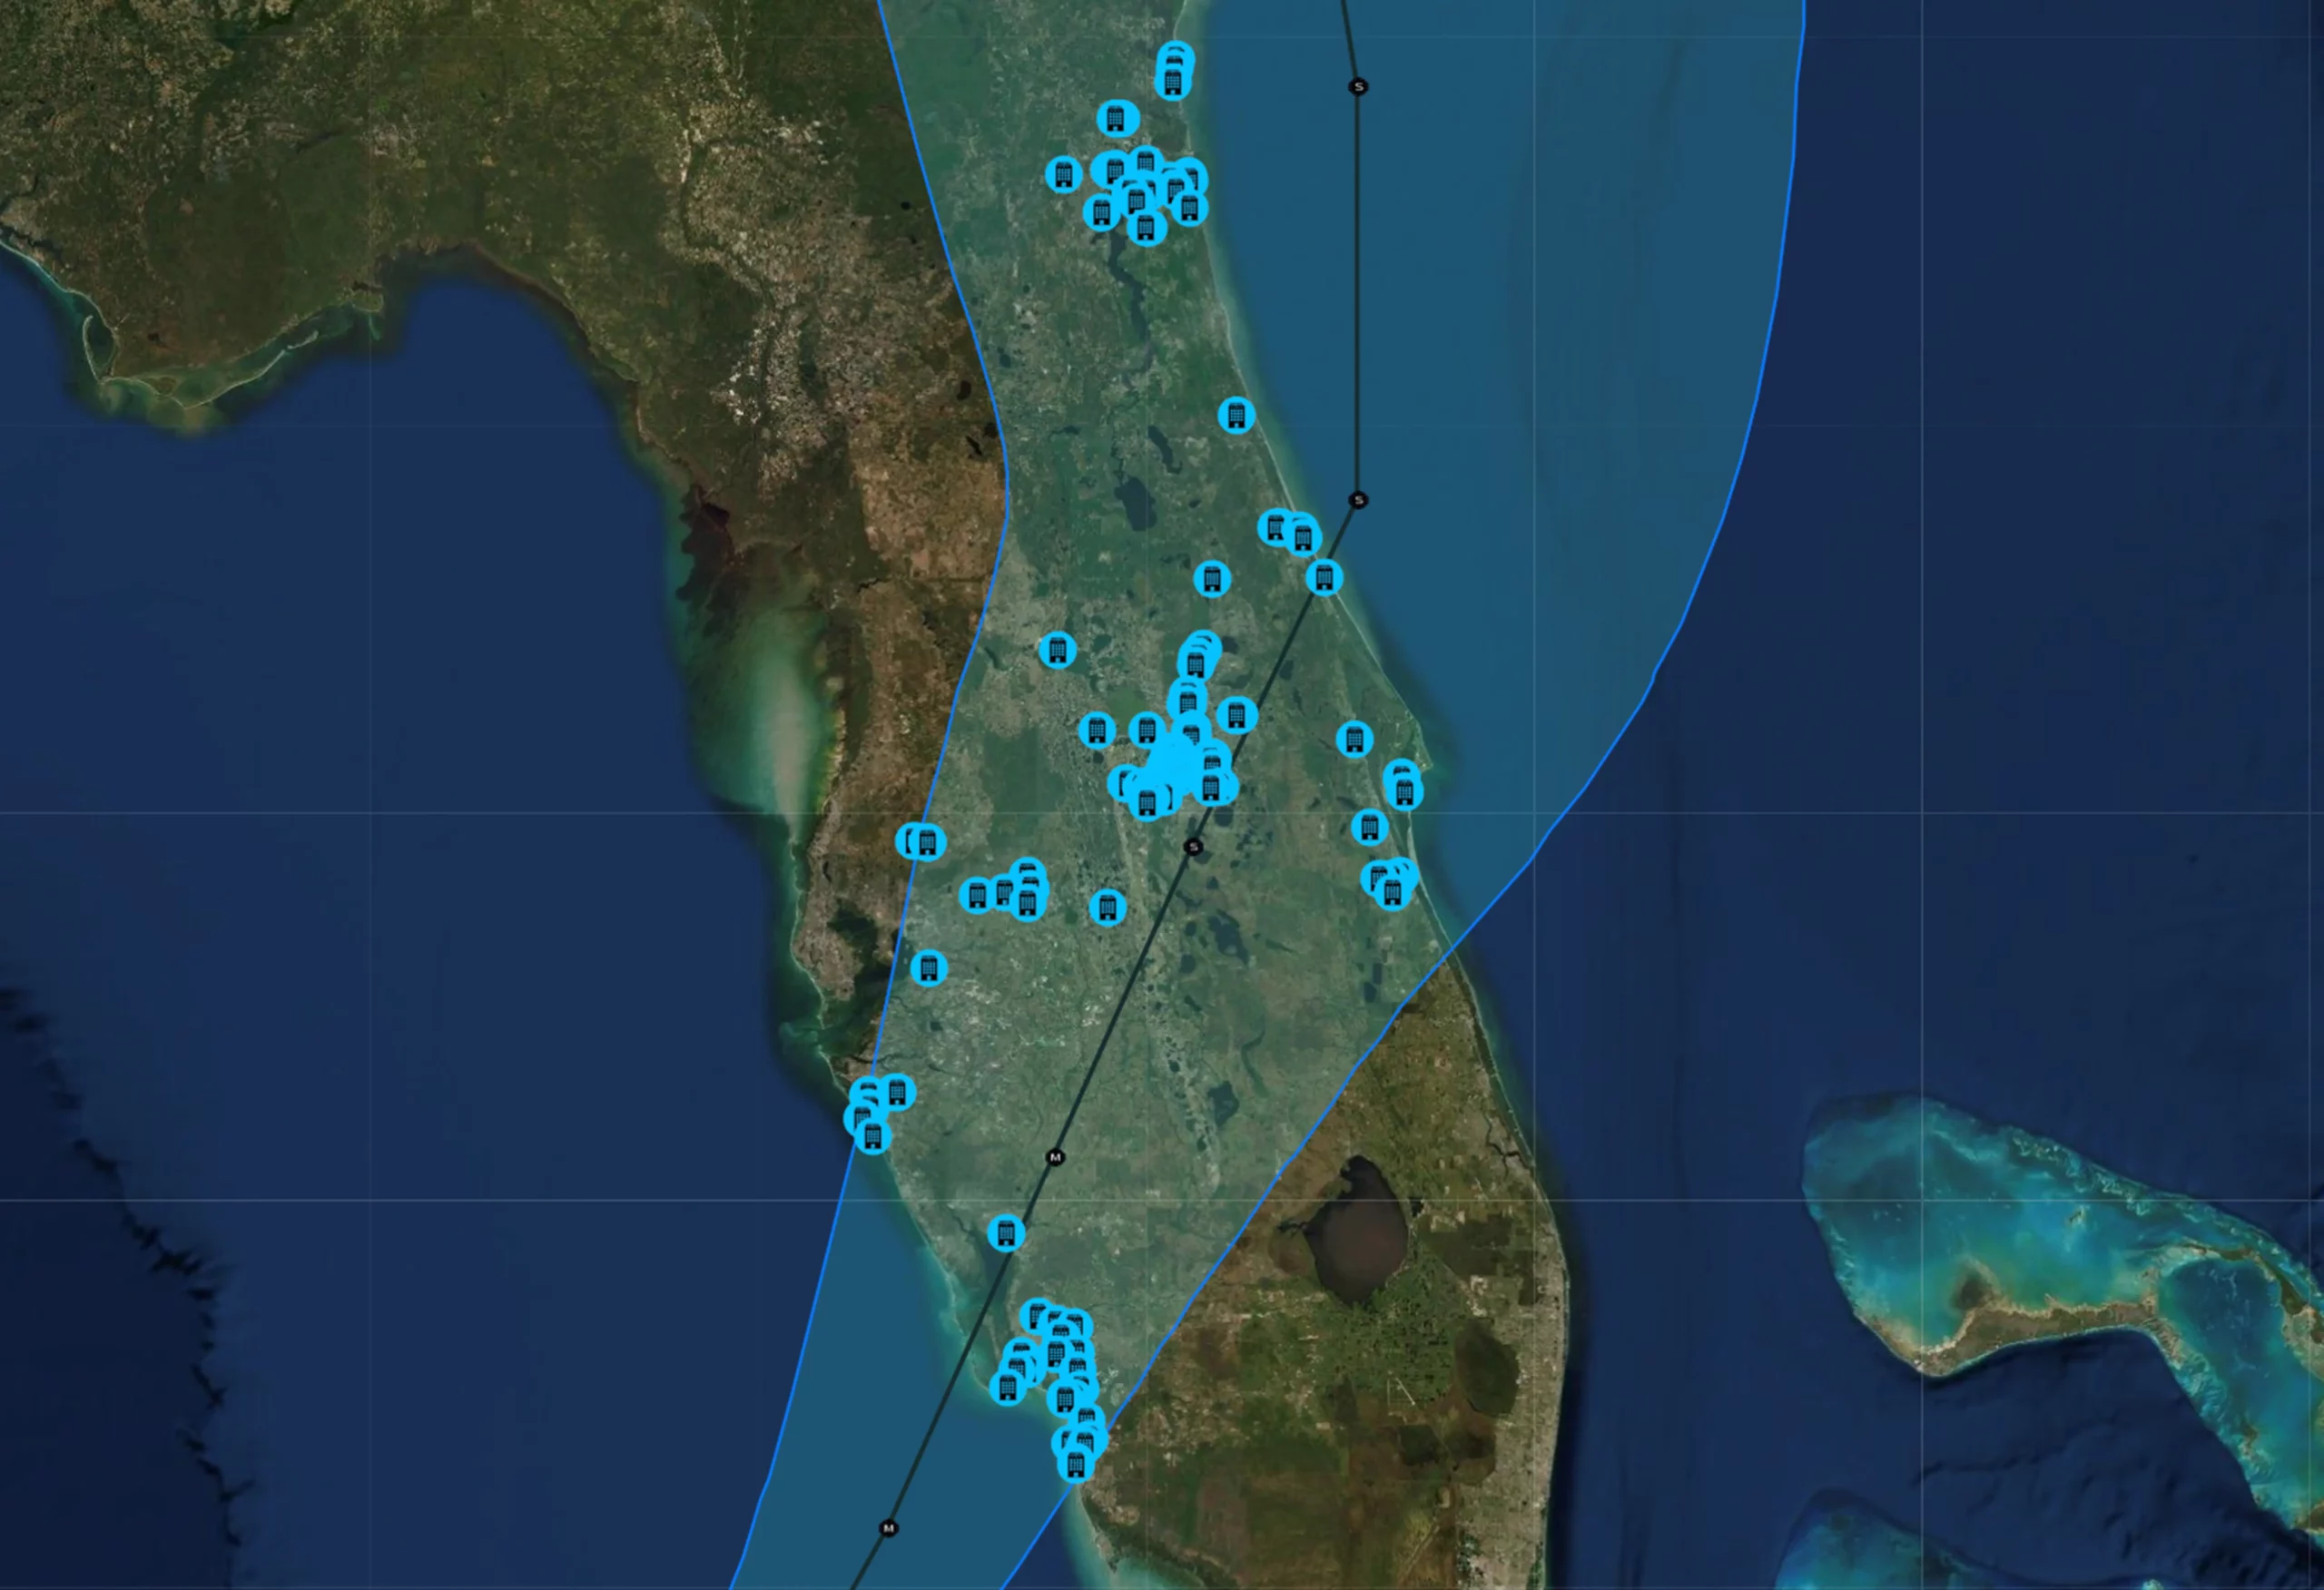
Figure 12 below provides a visual representation of the sample of ~200 luxury hotels that are potentially affected by the Hurricane’s landfall, both on the West and the East coast of Florida. This sample contains most 4 and 5-star hotels on the coast and Orlando area, as well as large 3-star hotels. Skytek can provide different asset categories if required.   

Figure 12: Samples of ~200 luxury hotel location within the cone of Hurricane Ian.

THEME PARKS

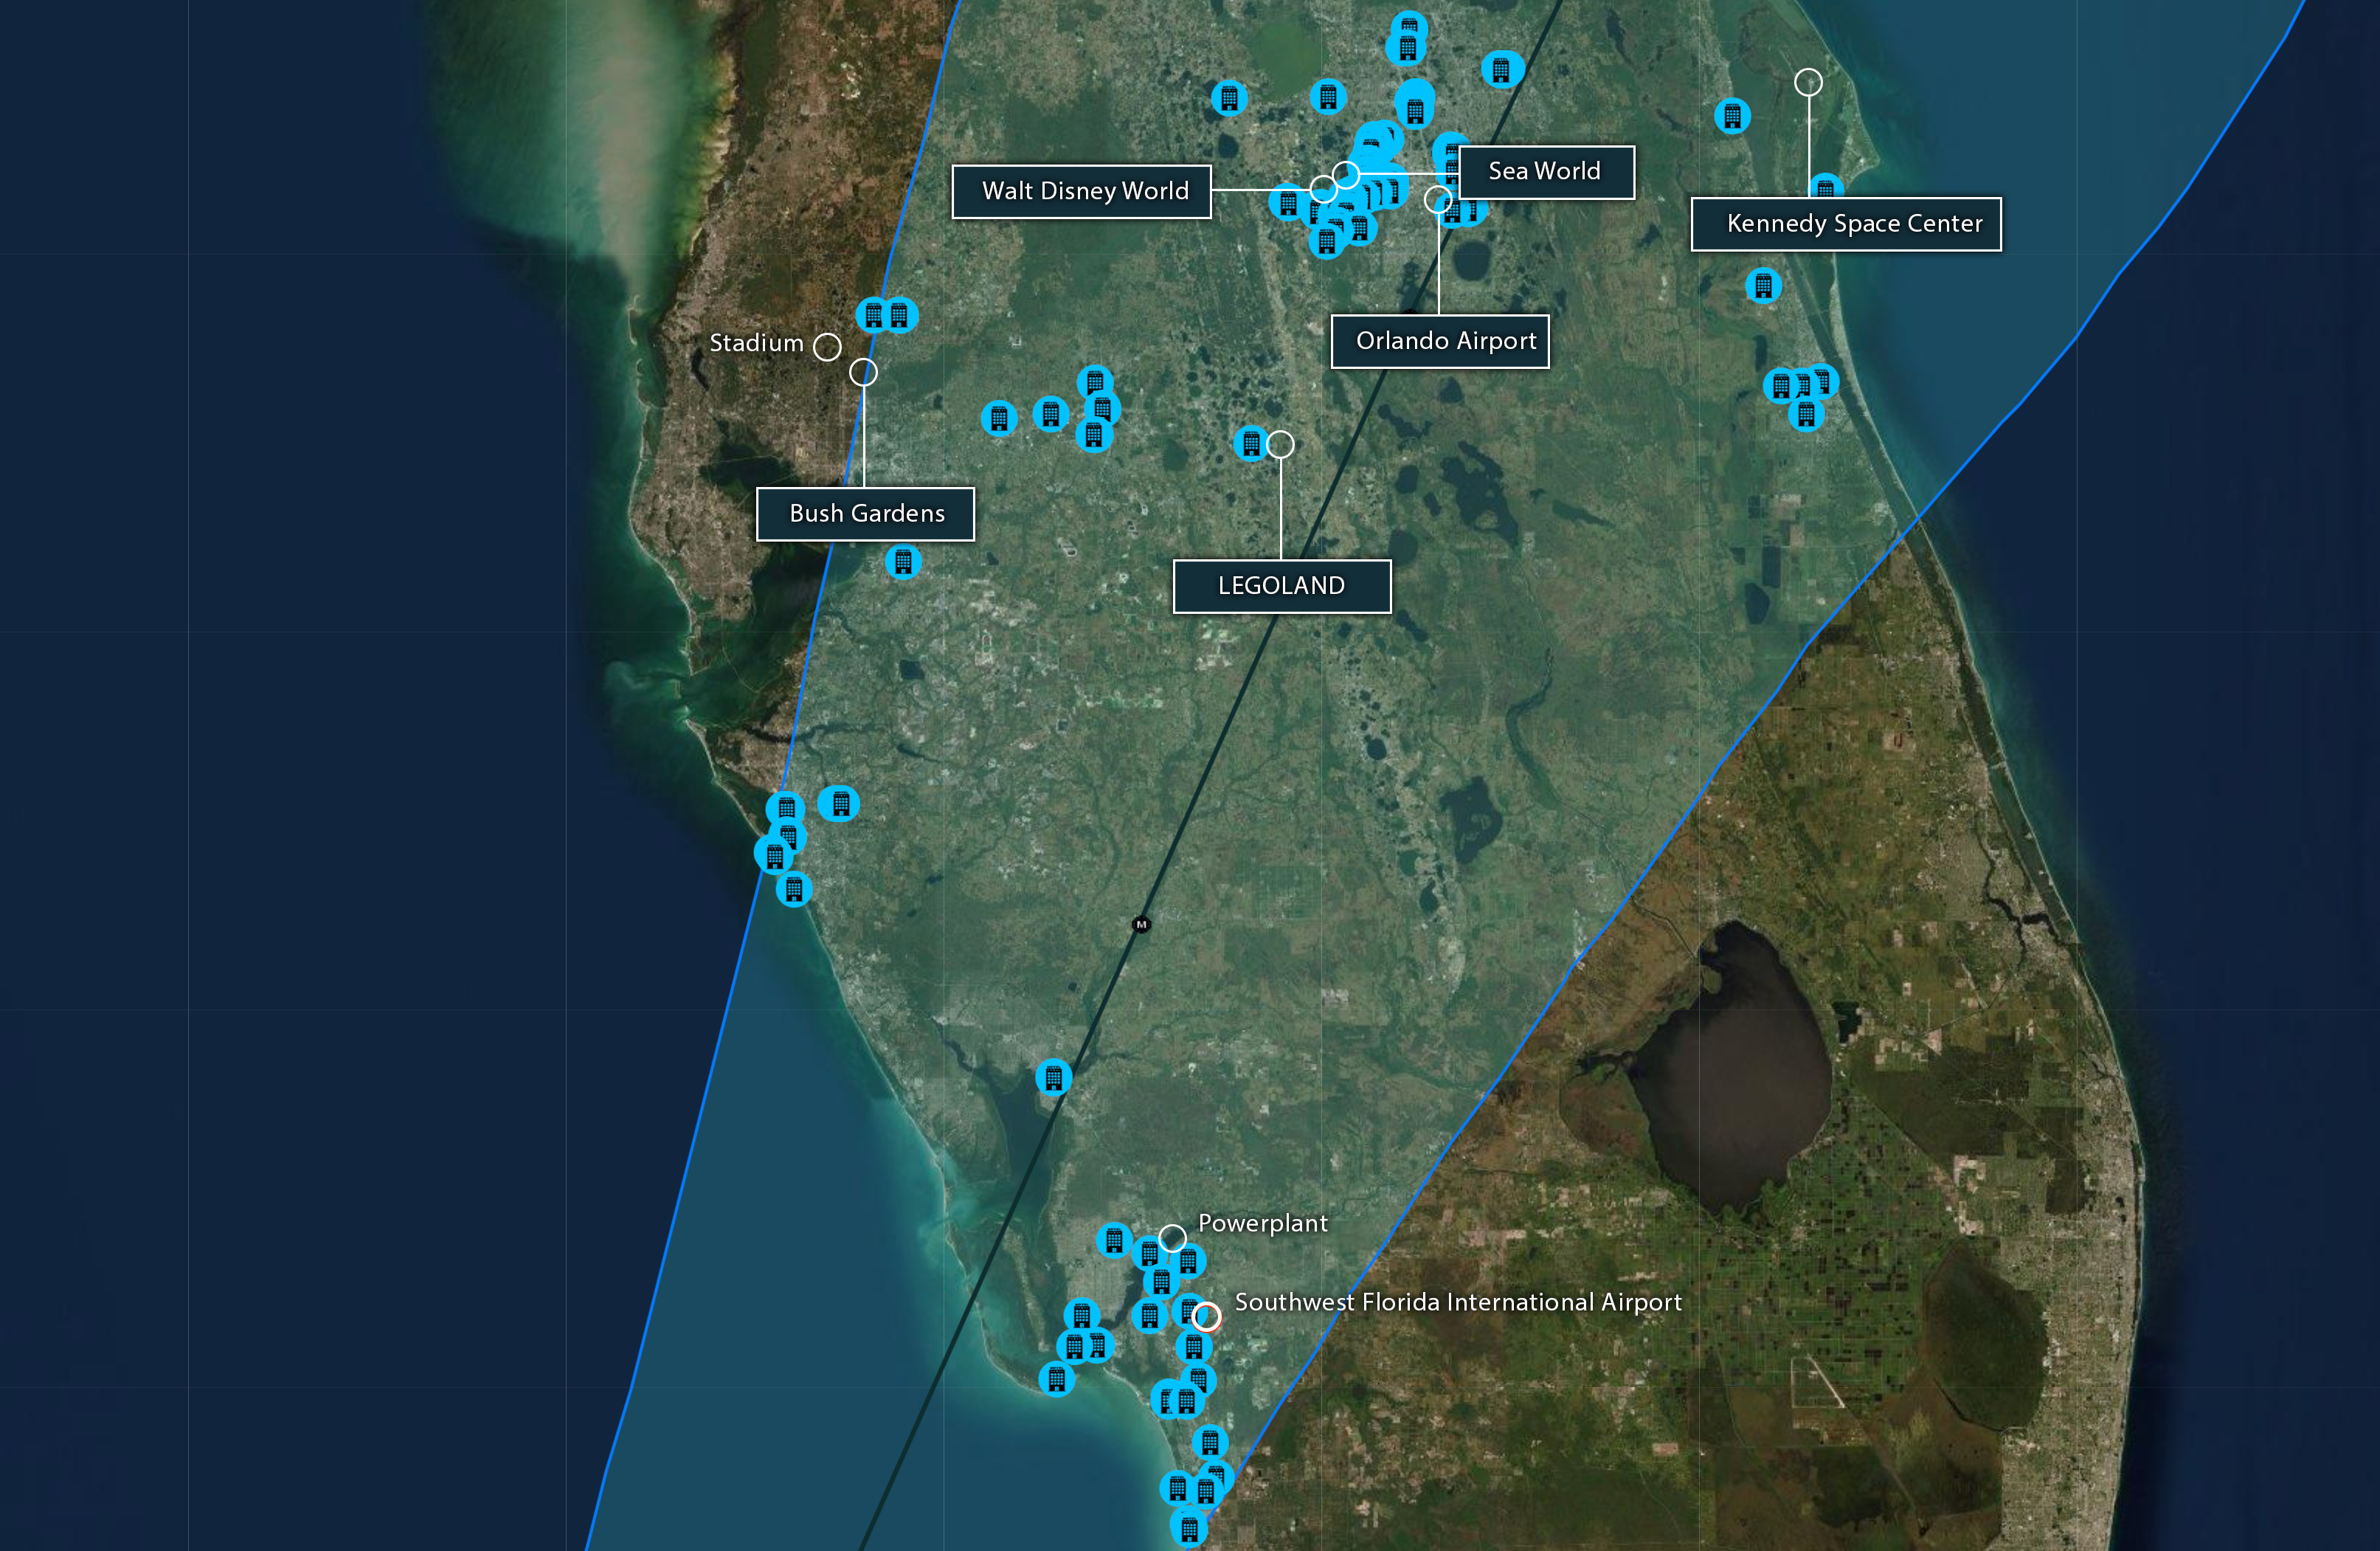
Skytek is monitoring the major theme parks present in the area, as they represent a significant exposure. The location of these assets is marked in the map below, Figure 13, relevant to the cone of the hurricane as currently predicted.

Figure 13: Theme Parks in the one of Hurricane Ian.

Using very high-resolution Earth Observation images, Skytek is able to provide in-depth and up-to-date information about the status of these theme parks, as well as the condition of the infrastructure around them. Pre-event satellite images have been procured and post-event satellite data will be tasked after the hurricane has passed, to provide an accurate and up-to-date view of the damage.
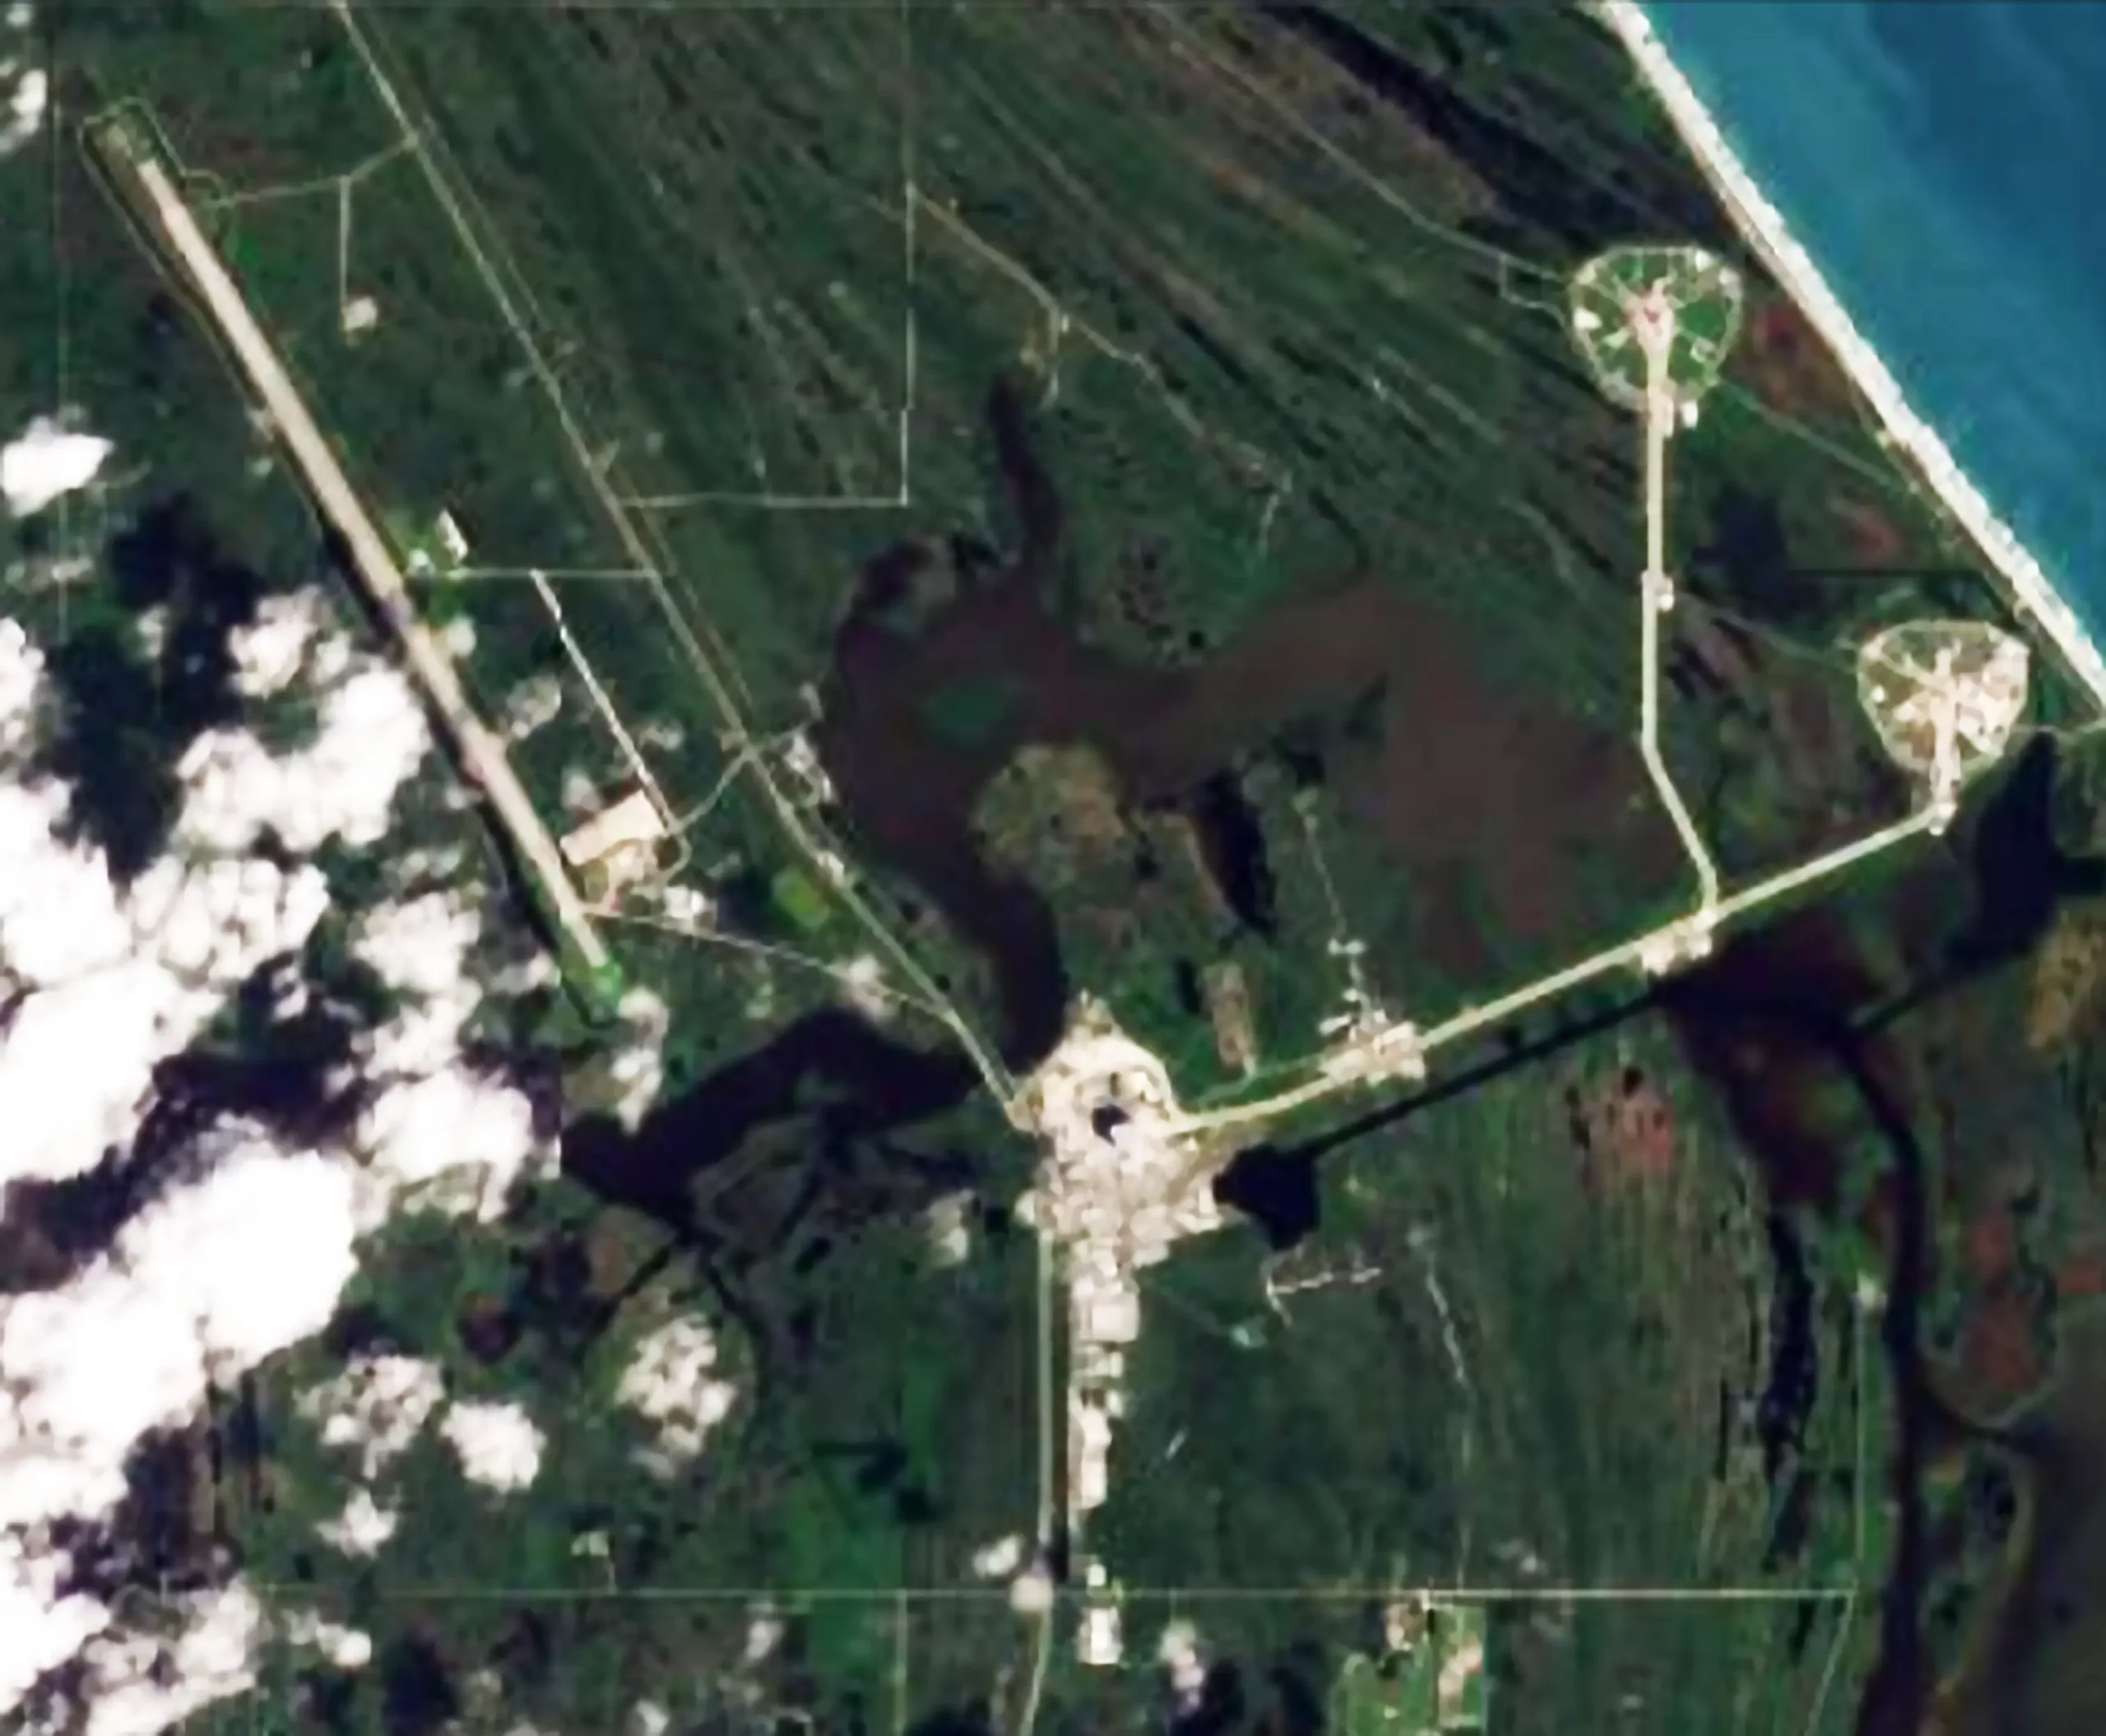
Figure 14: Kennedy Space Centre acquired by satellite on the 25th of September 2022.

AIRPORTS

This region of Florida is home to two airports, that Skytek is monitoring closely, using Earth Observation data:
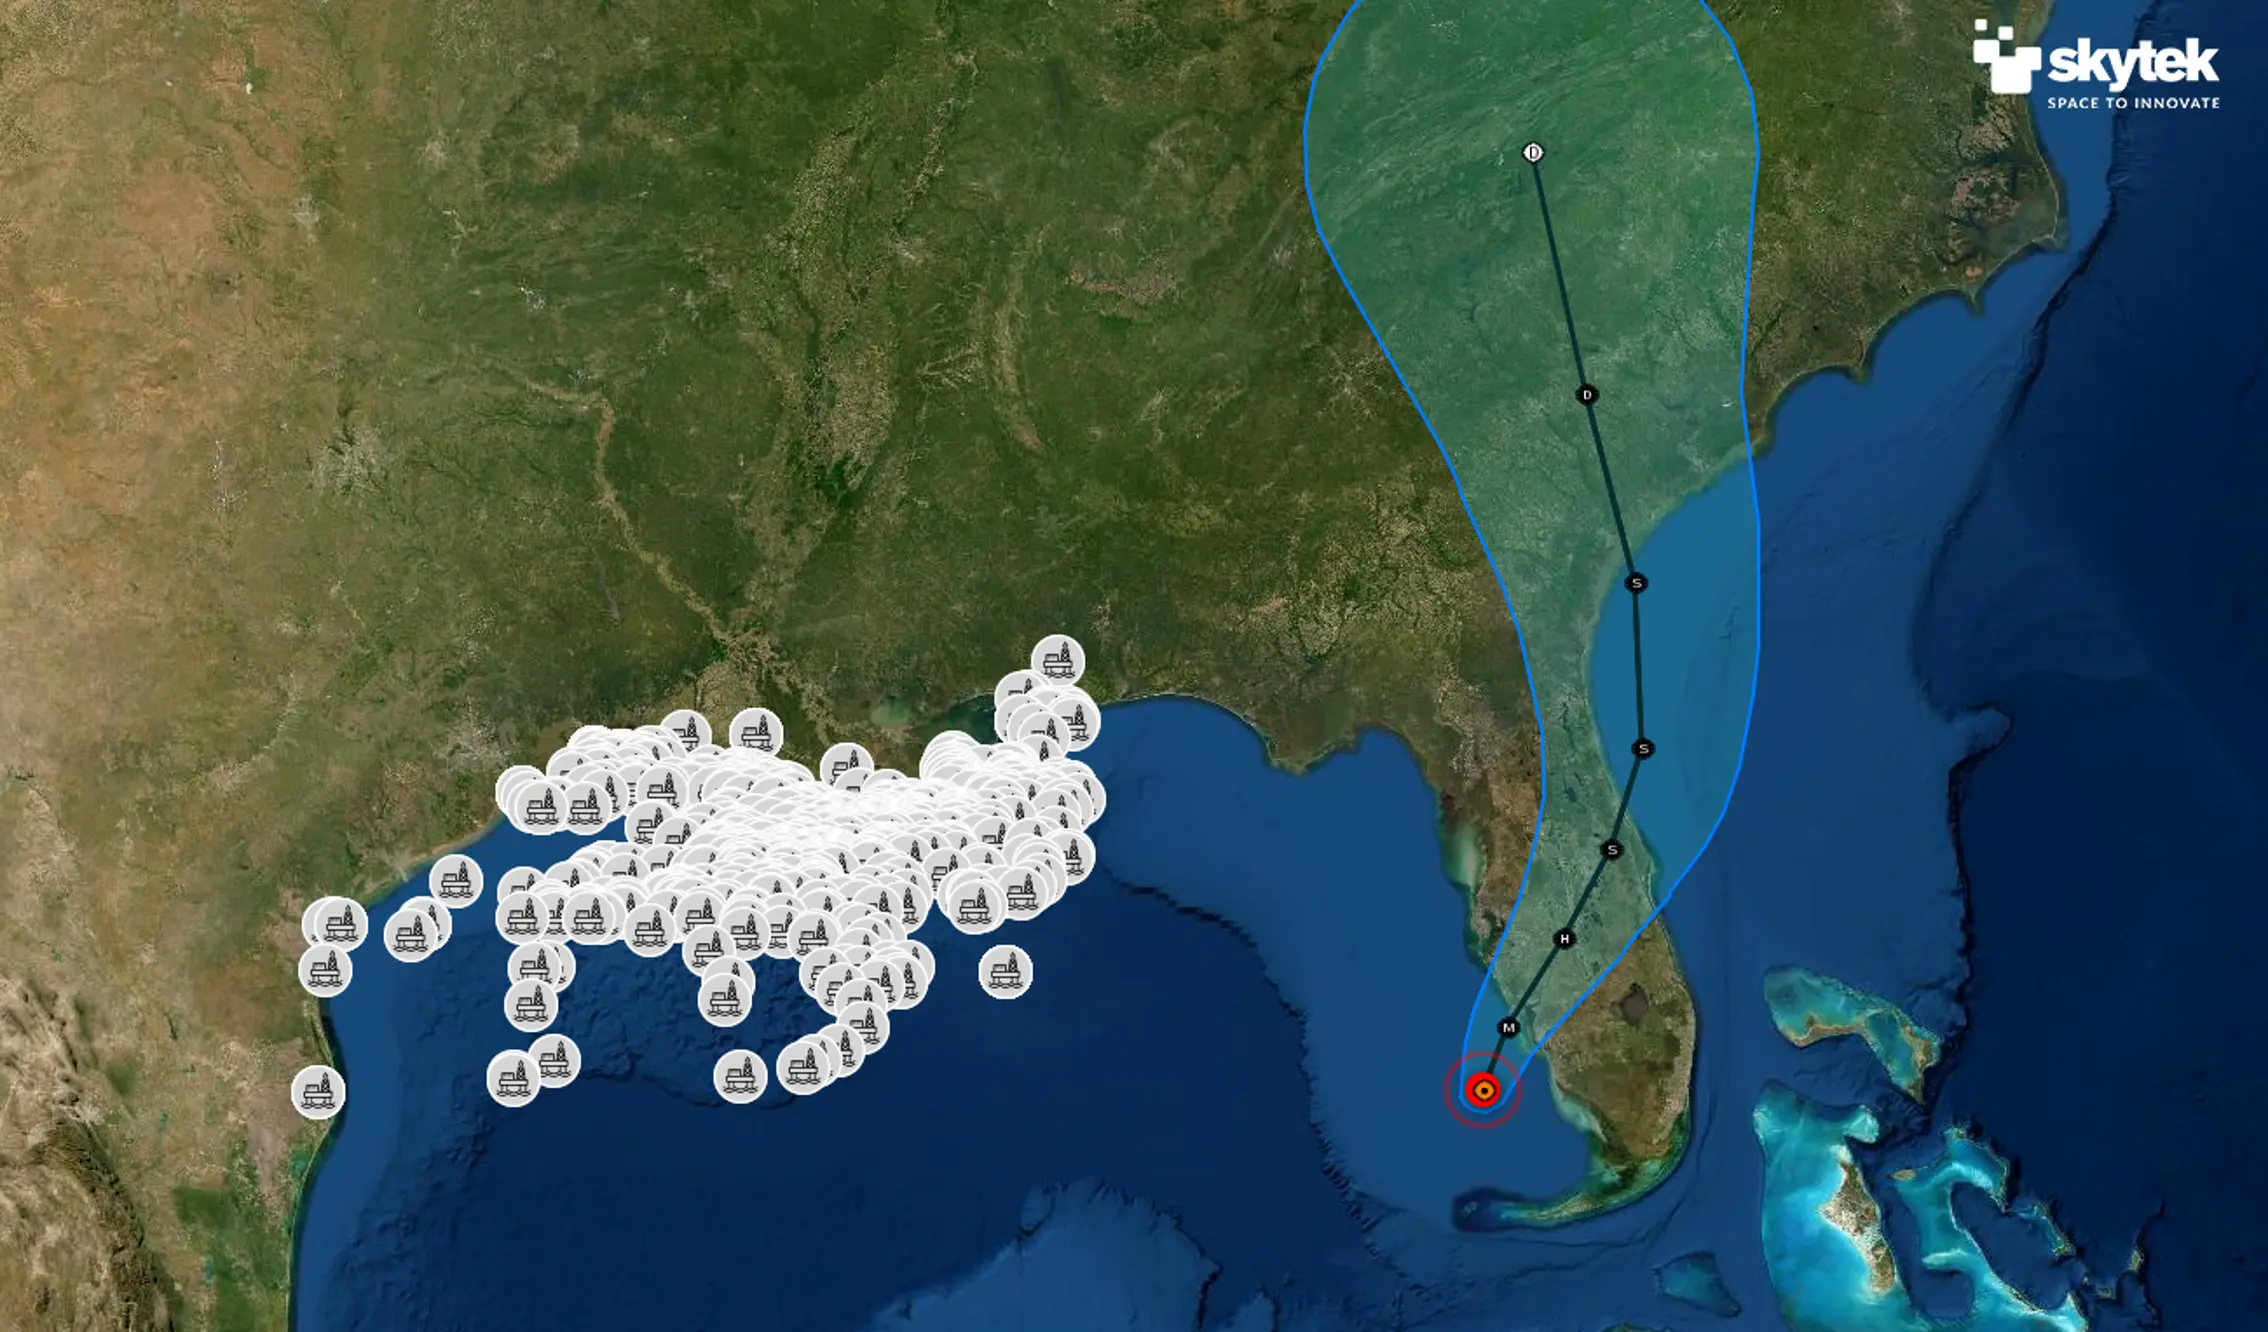
Southwest Florida International Airport (RSW) is a major airport in the South Fort Myers area of Lee County, Florida. The airport serves the Southwest Florida region and is a U.S. Customs and Border Protection port of entry. It currently is the second-busiest single-runway airport in the United States, as well as the third-largest airport in the United States in terms of land size.

A satellite image of the Southwest Florida International Airport is provided below, and it was acquired as a reference pre-event image:

Orlando International Airport (MCO) is a major public airport located southeast of Downtown Orlando, Florida. Orlando Airport is the busiest airport in the state and the seventh busiest airport in the United States.

A satellite image of Orlando International Airport is provided below, and it was acquired as a reference pre-event image:

Figure 15: Southwest Florida International Airport very-high resolution satellite image.
Figure 16: Orlando International Airport very-high resolution satellite image.

OIL RIGS EXPOSURE

Even though Hurricane Ian is passing well clear of the Gulf of Mexico oil fields (see Figure 16 below), the operators are taking precautionary measures due to the operating weather limits of the platforms. 12 platforms and two rigs were evacuated, and four DP/movable rigs were moved from their location. These measures had the effect of reducing the oil production in the Gulf of Mexico by 11% and gas production by 9%.

Figure 17: Skytek REACT system map of oil rigs in the Gulf of Mexico, and Hurricane Ian current cone.

Putting Earth Observation & Satellite Technology in the Hands of the Insurer

EO satellite image providers:

Disclaimer

The content in this report is provided for general information only. It is not intended to amount to advice on which any reliance should be placed. Skytek advises that professional or specialist advice is obtained before taking, or refraining from, any action on the basis of this report.

The contents of this report is provided in good faith but Skytek make no representations, warranties or guarantees, whether express or implied, that the contents of this report is accurate, complete or up to date.

To the extent permitted by law, Skytek will not be liable for any loss or damage, whether in contract, tort (including negligence), breach of statutory duty, or otherwise, even if foreseeable, arising under or in connection with use or reliance on any content of this report. In particular, Skytek will not be liable for any loss of profits, sales, business or revenue, business interruption, loss of anticipated savings, loss of business opportunity, goodwill or reputation or any indirect or consequential loss or damage whatsoever or howsoever caused.

Login