SUMMARY
In November 2020 (MEPC 75), the IMO approved amendments to MARPOL Annex VI to introduce a new technical efficiency standard for in-service vessels – the ‘Energy Efficiency Existing Ship Index’ (EEXI). The standard was adopted in June 2021 (MEPC 76), along with the issuance of the necessary guidelines on baselines, methods of calculations and ship-segment-specific requirements.
The EEXI will impose a requirement equivalent to Energy Efficiency Design Index (EEDI) Phase 2 or 3 (with some adjustments) to all existing ships regardless of the year of build. It is expected that the EEXI will require to be verified and a new International Energy Efficiency Certificate (IEEC) issued no later than the first annual International Air Pollution Prevention (IAPP) survey on or after 1 January 2023.
Amendments to the International Convention for the Prevention of Pollution from Ships (MARPOL) Annex VI entered into force on 1 November 2022. Developed under the framework of the Initial IMO Strategy on Reduction of GHG Emissions from Ships agreed in 2018, these technical and operational amendments require ships to improve their energy efficiency in the short term and thereby reduce their greenhouse gas emissions.
From 1 January 2023, it will be mandatory for all ships to calculate their attained Energy Efficiency Existing Ship Index (EEXI) to measure their energy efficiency and to initiate the collection of data for the reporting of their annual operational carbon intensity indicator (CII) and CII rating.
OVERVIEW OF THE REPORT
This document calculates the EEXI for a fleet of vessels, the required EEXI level and the required CII. Further, it assesses if the vessels comply with the EEXI requirements.
To comply with the regulation, the attained EEXI for a vessel must be less than or equal to the required EEXI. Once this condition is ascertained or achieved through appropriate measures, the owners will need to prepare an EEXI Technical File, for the certifying body to verify compliance with EEXI. In addition, ships using EPL to comply with EEXI should develop an Onboard Management Manual (OMM) using the guidance which will be approved by the IMO in June 2021.
PORTFOLIO OVERVIEW
A fleet of 28 ships was analysed for the purpose of EEXI and CII compliance. The vessels are classed as Oil and Chemical tankers and are trading worldwide.
The average vessel age is 10,1 years, with an aggregated Gross Tonnage of 705K.
PORTFOLIO UTILISATION METRICS
The fleet utilization metrics are used in the transport efficiency calculation, to obtain the CII. Skytek has calculated the voyage metrics for the fleet of interest and represented relevant data.
Adding to a commercial performance overview, Skytek mapped the yearly averages of voyage metrics and a graphical distribution of the ratio of the time spent in port, idle or carrying cargo between ports for the vessels in the fleet have been represented in Figure 1, with a comparative view for the past three years.

The sailing performance for each of the vessels is available to be analyzed for the past five years and Skytek represented the fleet sailing performance during 2021 Skytek mapped at a ship granular level the sailing performance for the fleet of interest during the year 2021 in Figure 2.
VOYAGE DATA TABLE
Period: 2021-01-01 - 2021-12-31
No. | Asset Name | IMO | MMSI | Distance (NM) | Avg Speed (kts) | Voyage Duration (Days) | Loitering Duration (Days) | Port Calls Duration (Days) | Port Call Count |
1 | ### | ### | ### | 53,204 | 9.83 | 225.55 | 76.53 | 62.93 | 20 |
2 | ### | ### | ### | 49,564 | 9.39 | 219.97 | 87.45 | 57.57 | 26 |
3 | ### | ### | ### | 48,493 | 9.55 | 211.47 | 103.06 | 50.48 | 18 |
4 | ### | ### | ### | 59,178 | 10.92 | 225.89 | 95.53 | 43.58 | 23 |
5 | ### | ### | ### | 68,443 | 10.85 | 262.75 | 59.49 | 42.77 | 23 |
6 | ### | ### | ### | 49,614 | 9.95 | 207.72 | 109.59 | 47.69 | 23 |
7 | ### | ### | ### | 65,954 | 10.49 | 261.95 | 68.07 | 34.98 | 25 |
8 | ### | ### | ### | 64,008 | 10.84 | 245.99 | 61.59 | 57.43 | 25 |
9 | ### | ### | ### | 73,867 | 12.36 | 248.99 | 78.94 | 37.07 | 22 |
10 | ### | ### | ### | 55,269 | 10.43 | 220.81 | 89.57 | 54.62 | 28 |
11 | ### | ### | ### | 54,763 | 10.63 | 214.70 | 77.82 | 72.48 | 26 |
12 | ### | ### | ### | 57,540 | 9.58 | 250.38 | 69.51 | 45.10 | 22 |
13 | ### | ### | ### | 55,174 | 10.98 | 209.42 | 113.70 | 41.88 | 19 |
14 | ### | ### | ### | 67,966 | 11.03 | 254.02 | 60.65 | 50.33 | 27 |
15 | ### | ### | ### | 61,668 | 10.72 | 239.70 | 63.94 | 61.36 | 29 |
16 | ### | ### | ### | 55,467 | 10.99 | 210.35 | 95.29 | 59.36 | 33 |
17 | ### | ### | ### | 74,849 | 11.12 | 280.42 | 47.06 | 37.52 | 19 |
18 | ### | ### | ### | 67,461 | 10.81 | 260.03 | 56.92 | 48.05 | 29 |
19 | ### | ### | ### | 67,101 | 11.23 | 249.06 | 68.12 | 47.82 | 21 |
20 | ### | ### | ### | 69,832 | 10.47 | 277.83 | 51.42 | 35.75 | 18 |
21 | ### | ### | ### | 53,816 | 10.46 | 214.42 | 85.83 | 64.75 | 32 |
22 | ### | ### | ### | 11,551 | 8.84 | 237.06 | 25.08 | 38.25 | 12 |
23 | ### | ### | ### | 62,681 | 10.73 | 243.35 | 77.07 | 44.58 | 22 |
24 | ### | ### | ### | 45,224 | 9.67 | 194.93 | 102.83 | 67.24 | 26 |
25 | ### | ### | ### | 66,306 | 10.32 | 267.65 | 73.54 | 23.81 | 16 |
26 | ### | ### | ### | 55,316 | 10.23 | 225.25 | 90.73 | 49.03 | 26 |
27 | ### | ### | ### | 39,056 | 9.94 | 163.63 | 59.73 | 72.94 | 21 |
28 | ### | ### | ### | 44,159 | 10.14 | 181.47 | 124.44 | 59.09 | 21 |
Figure 2 – Ship level voyage metrics during 2021
PORTFOLIO ESTIMATED EEXI AND CII
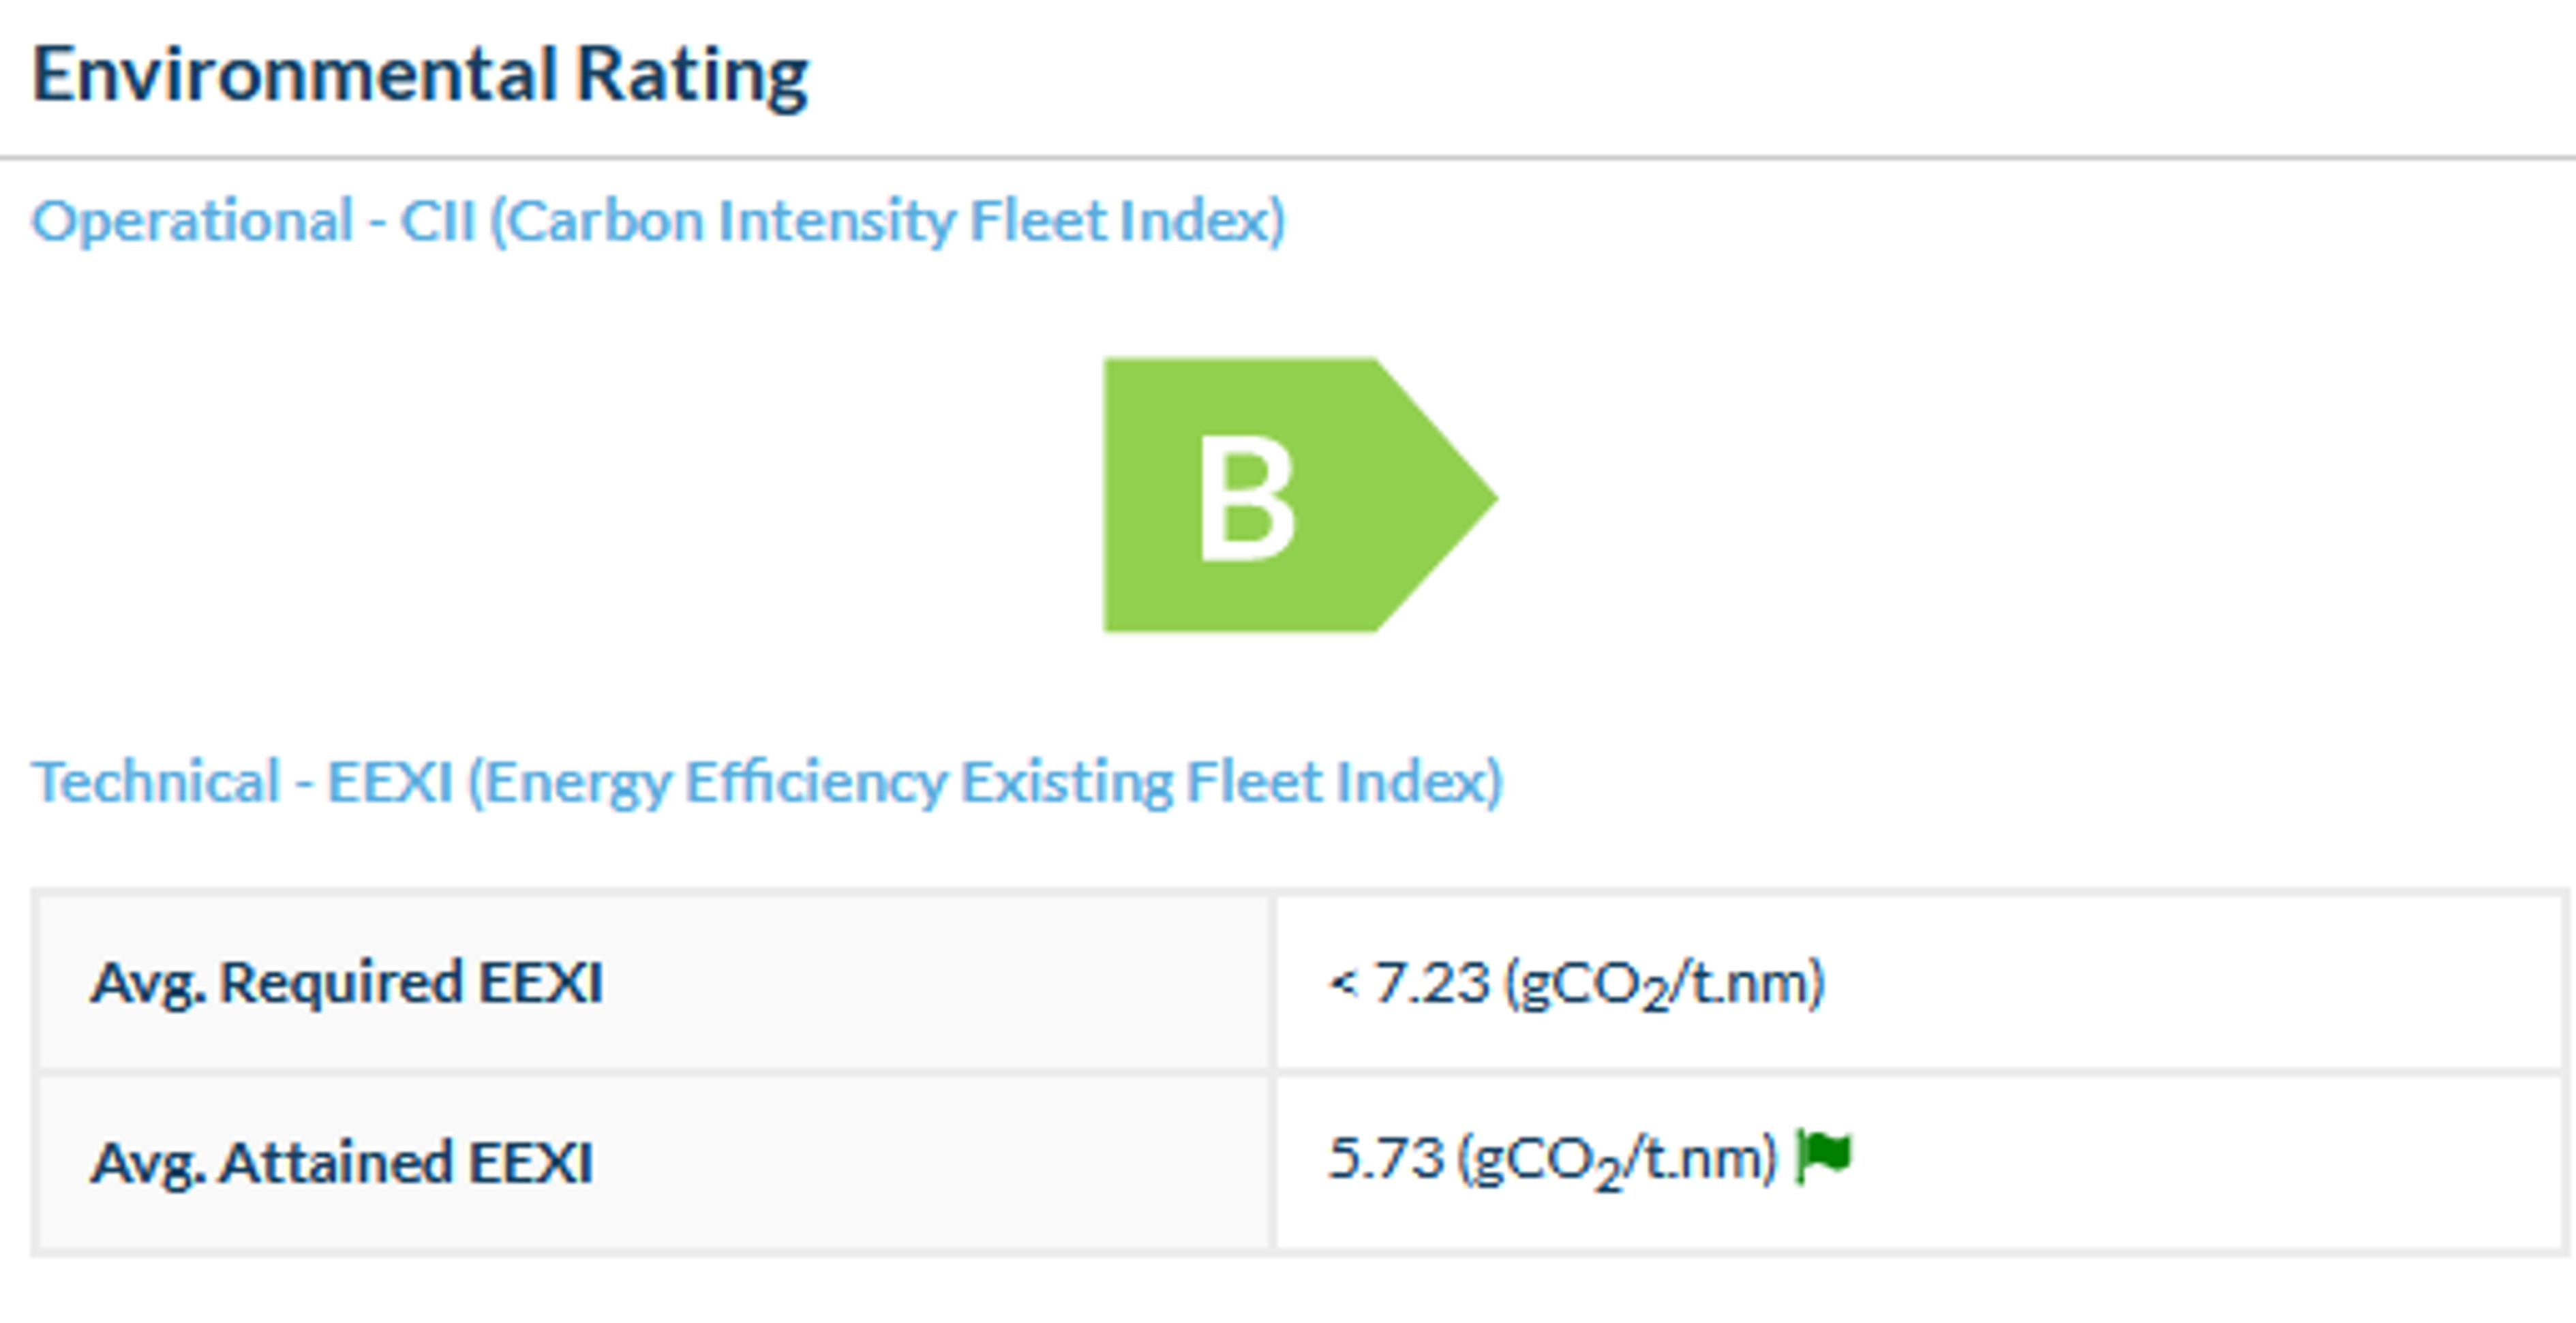
Skytek’s intelligence platform calculated the energy efficiency required metrics and found the fleet compliant for 2021, as represented in Figure 3:
PORTFOLIO DATA TABLE
No. | Asset | IMO | Flag | Type | Owner | Insured Value | Estimated Market Value | Risk Score | Environmental Rating | EEXI (gCO2/t.nm) |
1 | ### | ### | Marshall Islands | Products Tanker | ### | €15.0M | €13.2M | 16 | C | 5.69 |
2 | ### | ### | Marshall Islands | Products Tanker | ### | €10.0M | €13.1M | 11 | B | 5.61 |
3 | ### | ### | Marshall Islands | Products Tanker | ### | €15.0M | €13.0M | 19 | B | 5.61 |
4 | ### | ### | Singapore | Products Tanker | ### | €25.0M | €16.8M | 19 | C | 6.64 |
5 | ### | ### | Marshall Islands | Chemical/Products Tanker | ### | €30.0M | €22.6M | 17 | B | 6.64 |
6 | ### | ### | Marshall Islands | Chemical/Products Tanker | ### | €30.0M | €22.6M | 17 | C | 6.14 |
7 | ### | ### | Marshall Islands | Chemical/Products Tanker | ### | €18.0M | €24.2M | 17 | B | 4.88 |
8 | ### | ### | Marshall Islands | Chemical/Products Tanker | ### | €18.0M | €24.2M | 22 | B | 5.42 |
9 | ### | ### | Marshall Islands | Chemical/Products Tanker | ### | €18.0M | €22.6M | 11 | B | 4.67 |
10 | ### | ### | Marshall Islands | Chemical/Products Tanker | ### | €18.0M | €22.6M | 11 | B | 6.63 |
11 | ### | ### | Marshall Islands | Chemical/Products Tanker | ### | €18.0M | €24.1M | 21 | B | 5.35 |
12 | ### | ### | Marshall Islands | Chemical/Products Tanker | ### | €22.0M | €24.2M | 19 | B | 4.68 |
13 | ### | ### | Marshall Islands | Chemical/Products Tanker | ### | €18.0M | €24.1M | 11 | B | 4.64 |
14 | ### | ### | Marshall Islands | Chemical/Products Tanker | ### | €18.0M | €22.6M | 09 | B | 5.2 |
15 | ### | ### | Marshall Islands | Chemical/Products Tanker | ### | €32.0M | €21.8M | 09 | B | 5.03 |
16 | ### | ### | Marshall Islands | Chemical/Products Tanker | ### | €32.0M | €21.8M | 09 | B | 5.04 |
17 | ### | ### | Marshall Islands | Chemical/Products Tanker | ### | €25.0M | €16.6M | 17 | B | 6.84 |
18 | ### | ### | Marshall Islands | Chemical/Products Tanker | ### | €25.0M | €16.6M | 17 | B | 6.82 |
19 | ### | ### | Marshall Islands | Chemical/Products Tanker | ### | €25.0M | €16.6M | 14 | B | 6.63 |
20 | ### | ### | Marshall Islands | Chemical/Products Tanker | ### | €25.0M | €16.6M | 17 | B | 6.58 |
21 | ### | ### | Marshall Islands | Chemical/Products Tanker | ### | €30.0M | €33.9M | 09 | B | 5.72 |
22 | ### | ### | Marshall Islands | Chemical/Products Tanker | ### | €30.0M | €33.9M | 17 | B | 5.61 |
23 | ### | ### | Marshall Islands | Chemical/Products Tanker | ### | €30.0M | €33.9M | 09 | B | 6.21 |
24 | ### | ### | Germany | Chemical/Products Tanker | ### | €22.0M | €11.5M | 20 | B | 6.25 |
25 | ### | ### | Marshall Islands | Chemical/Products Tanker | ### | €30.0M | €33.9M | 09 | B | 5.05 |
26 | ### | ### | Liberia | Chemical/Products Tanker | ### | €22.0M | €8.5M | 15 | B | 6.48 |
27 | ### | ### | Portugal | Chemical/Products Tanker | ### | €22.0M | €7.2M | 23 | B | 5.2 |
28 | ### | ### | Cook Islands | Chemical/Products Tanker | ### | €22.0M | €6.6M | 33 | B | 5.2 |
Figure 4 – Fleet overview data
CONCLUSION
With the entire portfolio complying with the EEXI, 89% of the fleet rated on the operational carbon intensity index at B and only three ships rated at C, the Owner of the fleet does not have to take any mandatory action to improve the fleet’s performance.
Available energy efficiency optimization steps, such as those listed below, are not required:
- Engine Power Limitation (EPL)
- Installing energy-saving devices like rotating sails, bulbous bow or propeller fins
However, to improve commercial efficiency and ensure maintaining the attained ratings.
Owners can consider:
- Trim and draft optimization
- Propeller polishing
- Hull Cleaning
- Speed management
- Weather routing


